The following bar graph shows the number of houses (out of 100) in a town using different types of fuels for cooking.
Read the bar graph and answer the following questions:
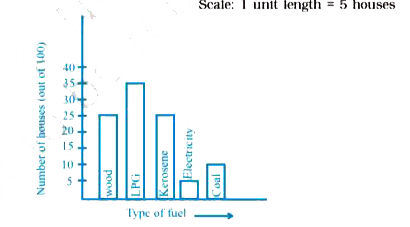
How many houses are using coal as fuel?
Step by step video & image solution for The following bar graph shows the number of houses (out of 100) in a town using different types of fuels for cooking. Read the bar graph and answer the following questions: How many houses are using coal as fuel? by Maths experts to help you in doubts & scoring excellent marks in Class 6 exams.
Updated on:21/07/2023Topper's Solved these Questions
Similar Questions
The following bar graph shows the number of houses (out of 100) in a town using different types of fuels for cooking.
Read the bar graph and answer the following questions:
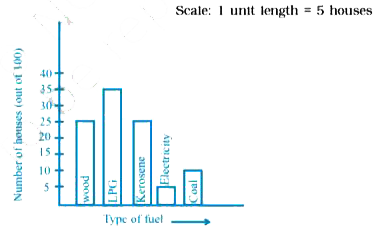
Suppose that the total number of houses in the town is 1 lakh. From the above graph estimate the number of houses using electricity.
View SolutionThe following bar graph shows the number of houses (out of 100) in a town using different types of fuels for cooking.
Read the bar graph and answer the following questions:
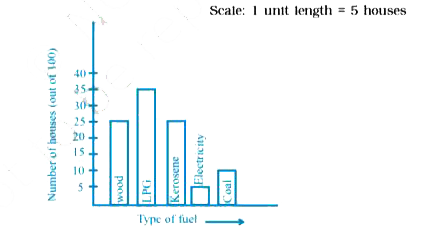
Which fuel is used in maximum number of houses?
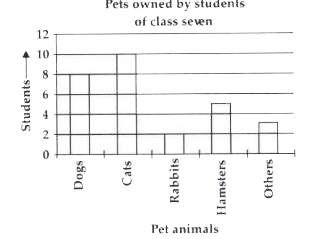
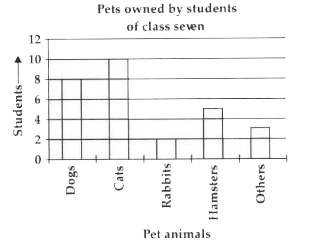
View SolutionUse the bar graph to answer the following questions
How many students have dog as a pet ?
View SolutionRead the bar graph and answer the following questons.
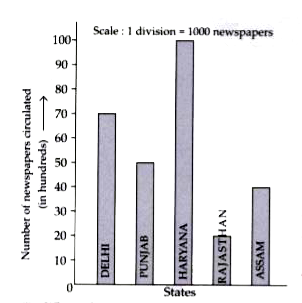
What information is given by graph ?
View SolutionLook at the bar graph and answer the following questions.
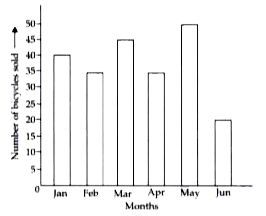
How many less bicycles sold in June than in March?
View SolutionRead the graph and answer the following questions
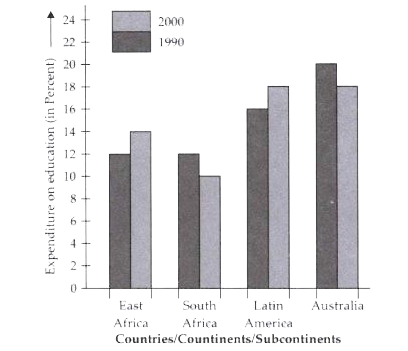
Give a suitable title to bar graph
View SolutionUse the bar graph to answer the following questions
Which is the most popular pet ?
View SolutionStudy the bar graph and answer the following questions.
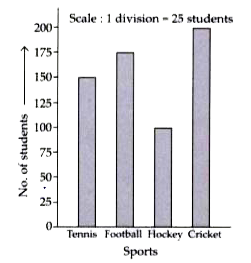
Which is the most popular sport ?
View SolutionStudy the bar graph and answer the following questions.
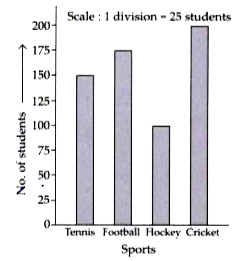
Which sport is preferred least ?
View SolutionRead the bar graph carefully and answer the following questions.
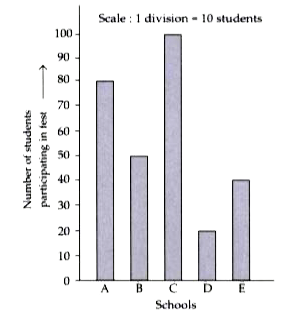 How may students of school B participated in the fest ?
View Solution
