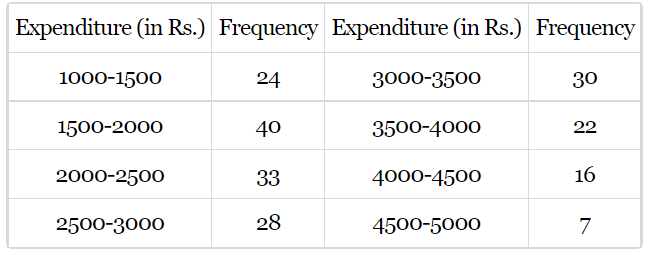
The following data gives the distribution of total household
expenditure (in rupees) of manual workers in a city:

Find the average expenditure which is being done by the maximum number
of manual workers.
Step by step video & image solution for The following data gives the distribution of total household expenditure (in rupees) of manual workers in a city: Find the average expenditure which is being done by the maximum number of manual workers. by Maths experts to help you in doubts & scoring excellent marks in Class 10 exams.
Topper's Solved these Questions
Similar Questions
The following data gives the distribution of total household expendilture ( in Rs.) of workers is a city :

Find the average expenditure which is being done by maximum number of manual workers.View SolutionThe following table gives the distribution of total household expenditure (in rupees) of manual workers in a city. Expenditure (in rupees) (xi) Frequency (fi) 100-150 24 150-200 40 200-250 33 250-300 28 300-350 30 350-450 22 400-450 16 450-500 7 Find the average expenditure (in rupees) per household.
View SolutionThe following table gives the distribution of total household expenditure (in rupees) of manual workers in a city. Expenditure: (in Rs.) 100-150 150-200 200-250 250-300 300-350 350-400 400-450 450-500 Frequency: 24 40 33 28 30 22 16 7 Find the average expenditure (in Rs.) per household.
View SolutionThe following data gives the distribution of total monthly household expenditure of 200 families of a village. Find the modal monthly expenditure of the families. Also, find the mean monthly expenditure:
View SolutionIn the following table, the total expenditure of the labourers of a city is given

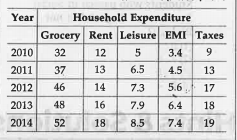
Find the average expenditure by deviation method.View SolutionStudy the following table and answer the questions based on it. Below is the Household is Expenditure (in Thousand Rupees) per annum

What is the average spending on Leisure per annum?View SolutionThe following table gives the information of frequency distribution of weekly wages of 150 workers of a company .Find the mean ofg the weekly wages by 'step devition'Method.
 View Solution
The following table gives the information of frequency distribution of weekly wages of 150 workers of a company. Find the mean of the weekly wages by 'step deviation' method.
 View Solution
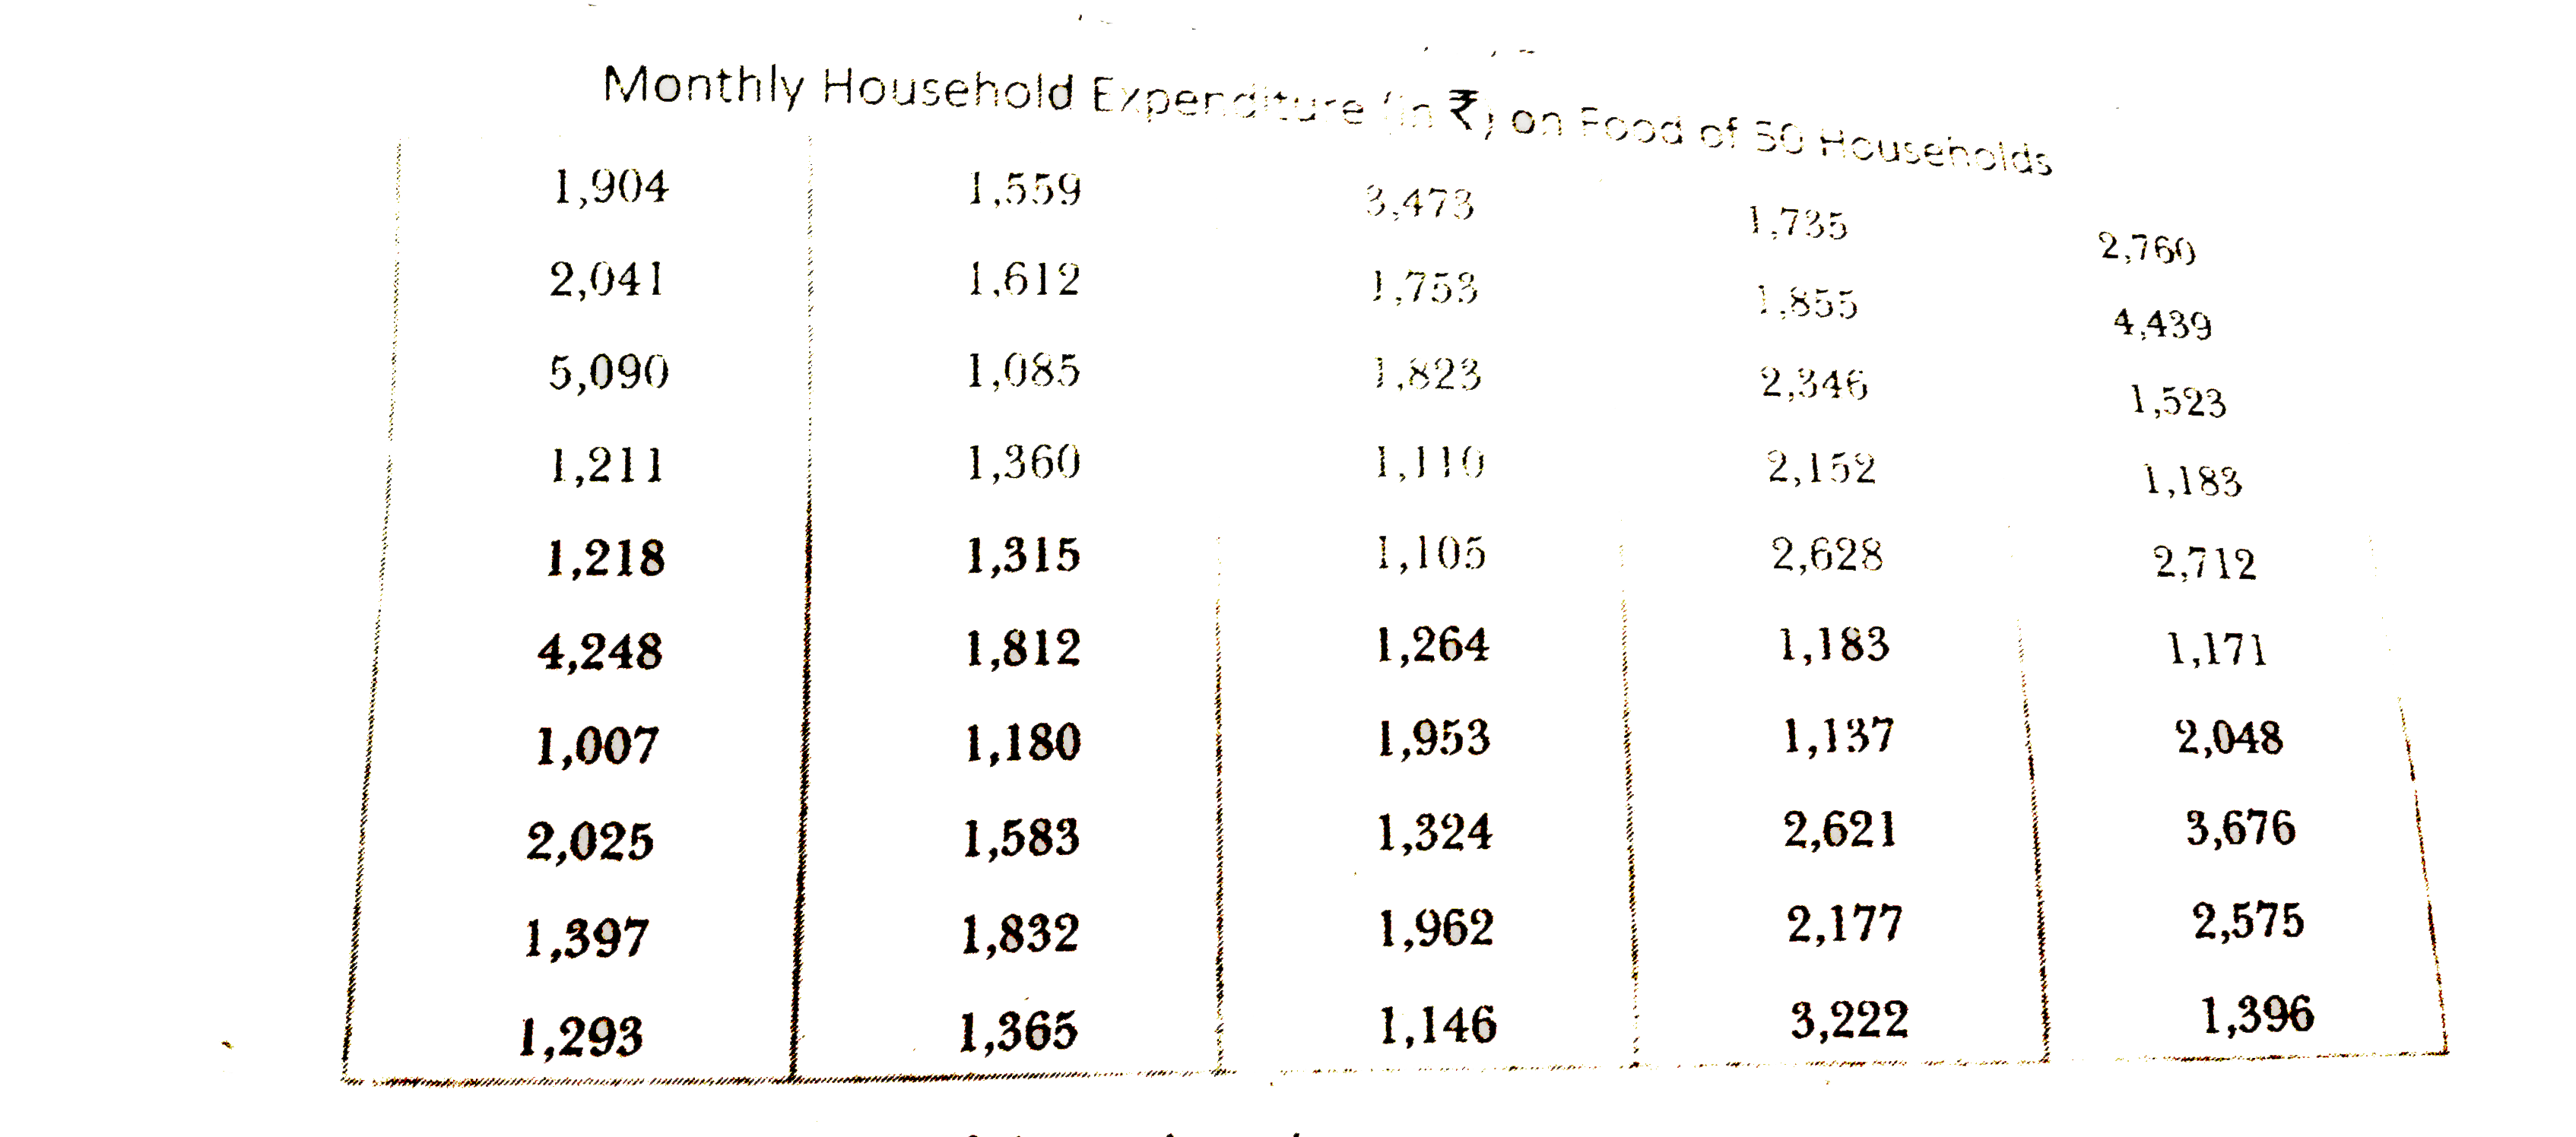
Use the data in following table that relate to monthly household expenditure (in Rs.) on food of 50 households, and
(i) Obtain the range of monthly household expenditure on food.
(ii) Divide the range into appropriate number of class intervals and obtain the frequency distribution of expenditure.
(iii) Find the number of households whose monthly expenditure on food is
(a) less than Rs. 2,000, (b) more than Rs. 3,000, (c) between Rs. 1,500 and Rs. 500.
 View Solution
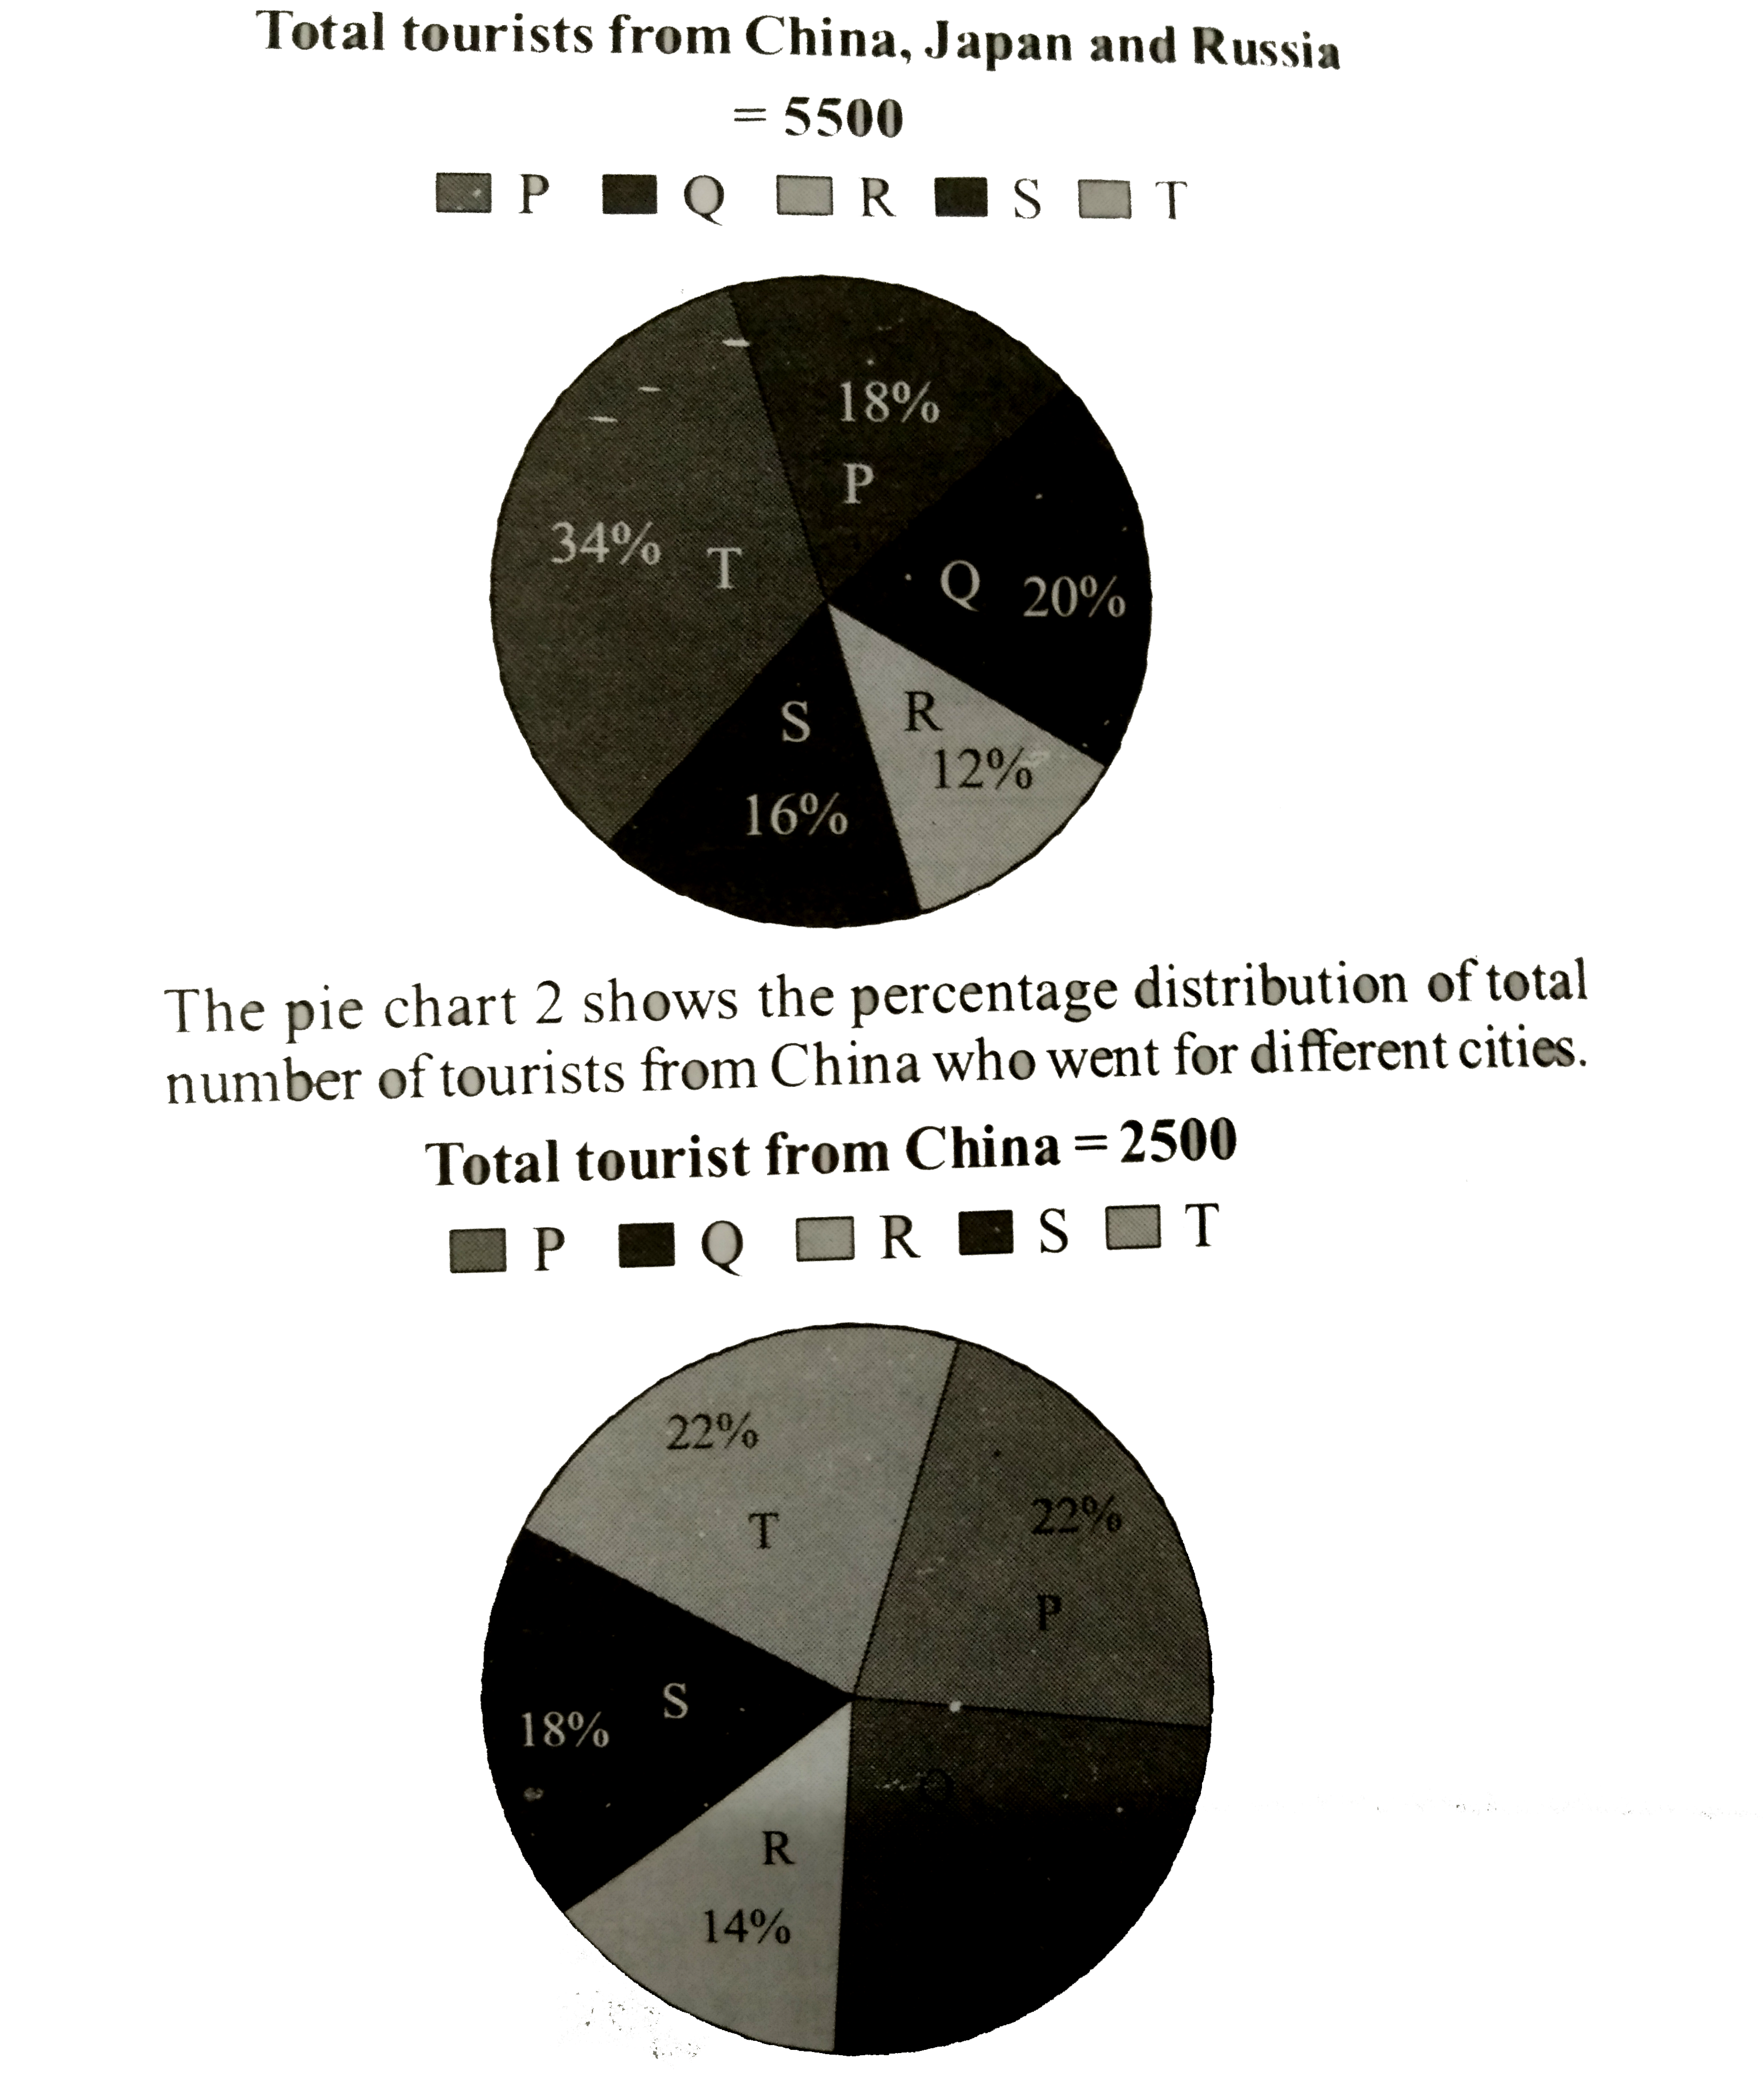
The following pie chart 1 shows the percentage distribution of total number of tourists from China, Japan and Russia who went for different cities.

Find the difference between the total number of tourists from Japan and Russia in city. T with the total number of tourists from Japan and Russia in city S ?View Solution

