The marks scored by 750 students in an examination are given in the form of a frequency distribution table: Marks No. of students Marks No. of students 600-640 16 760-800 172 640-680 45 800-840 59 680-720 156 840-880 18 720-760 284 Prepare a cumulative frequency table by less than method and draw an ogive.
Step by step video & image solution for The marks scored by 750 students in an examination are given in the form of a frequency distribution table: Marks No. of students Marks No. of students 600-640 16 760-800 172 640-680 45 800-840 59 680-720 156 840-880 18 720-760 284 Prepare a cumulative frequency table by less than method and draw an ogive. by Maths experts to help you in doubts & scoring excellent marks in Class 10 exams.
Updated on:21/07/2023Topper's Solved these Questions
Similar Questions
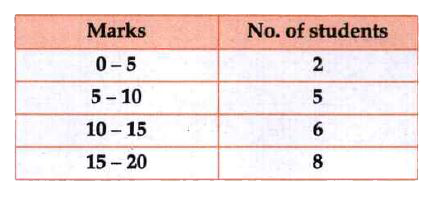
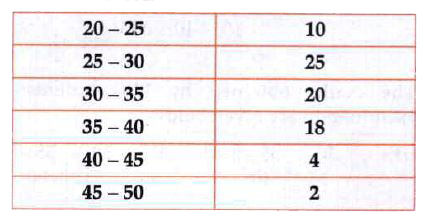
The marks obtained by 200 students in an examination are given below. : Draw a less than ogive for the above distribution and use less than ogive to find median.
View SolutionPercentage of marks of 35 students is given in the following grouped frequency distribution table.

How many students scored less than 90% of marks?
View SolutionPercentage of marks of 35 students is given in the following grouped frequency distribution table.

How many students scored 70% and more than 70% of marks?
View SolutionThe marks obtained by 100 students of class is an examination are given below:


Draw 'a less than' type cumulative frequency curves (ogive). Hence, find median.
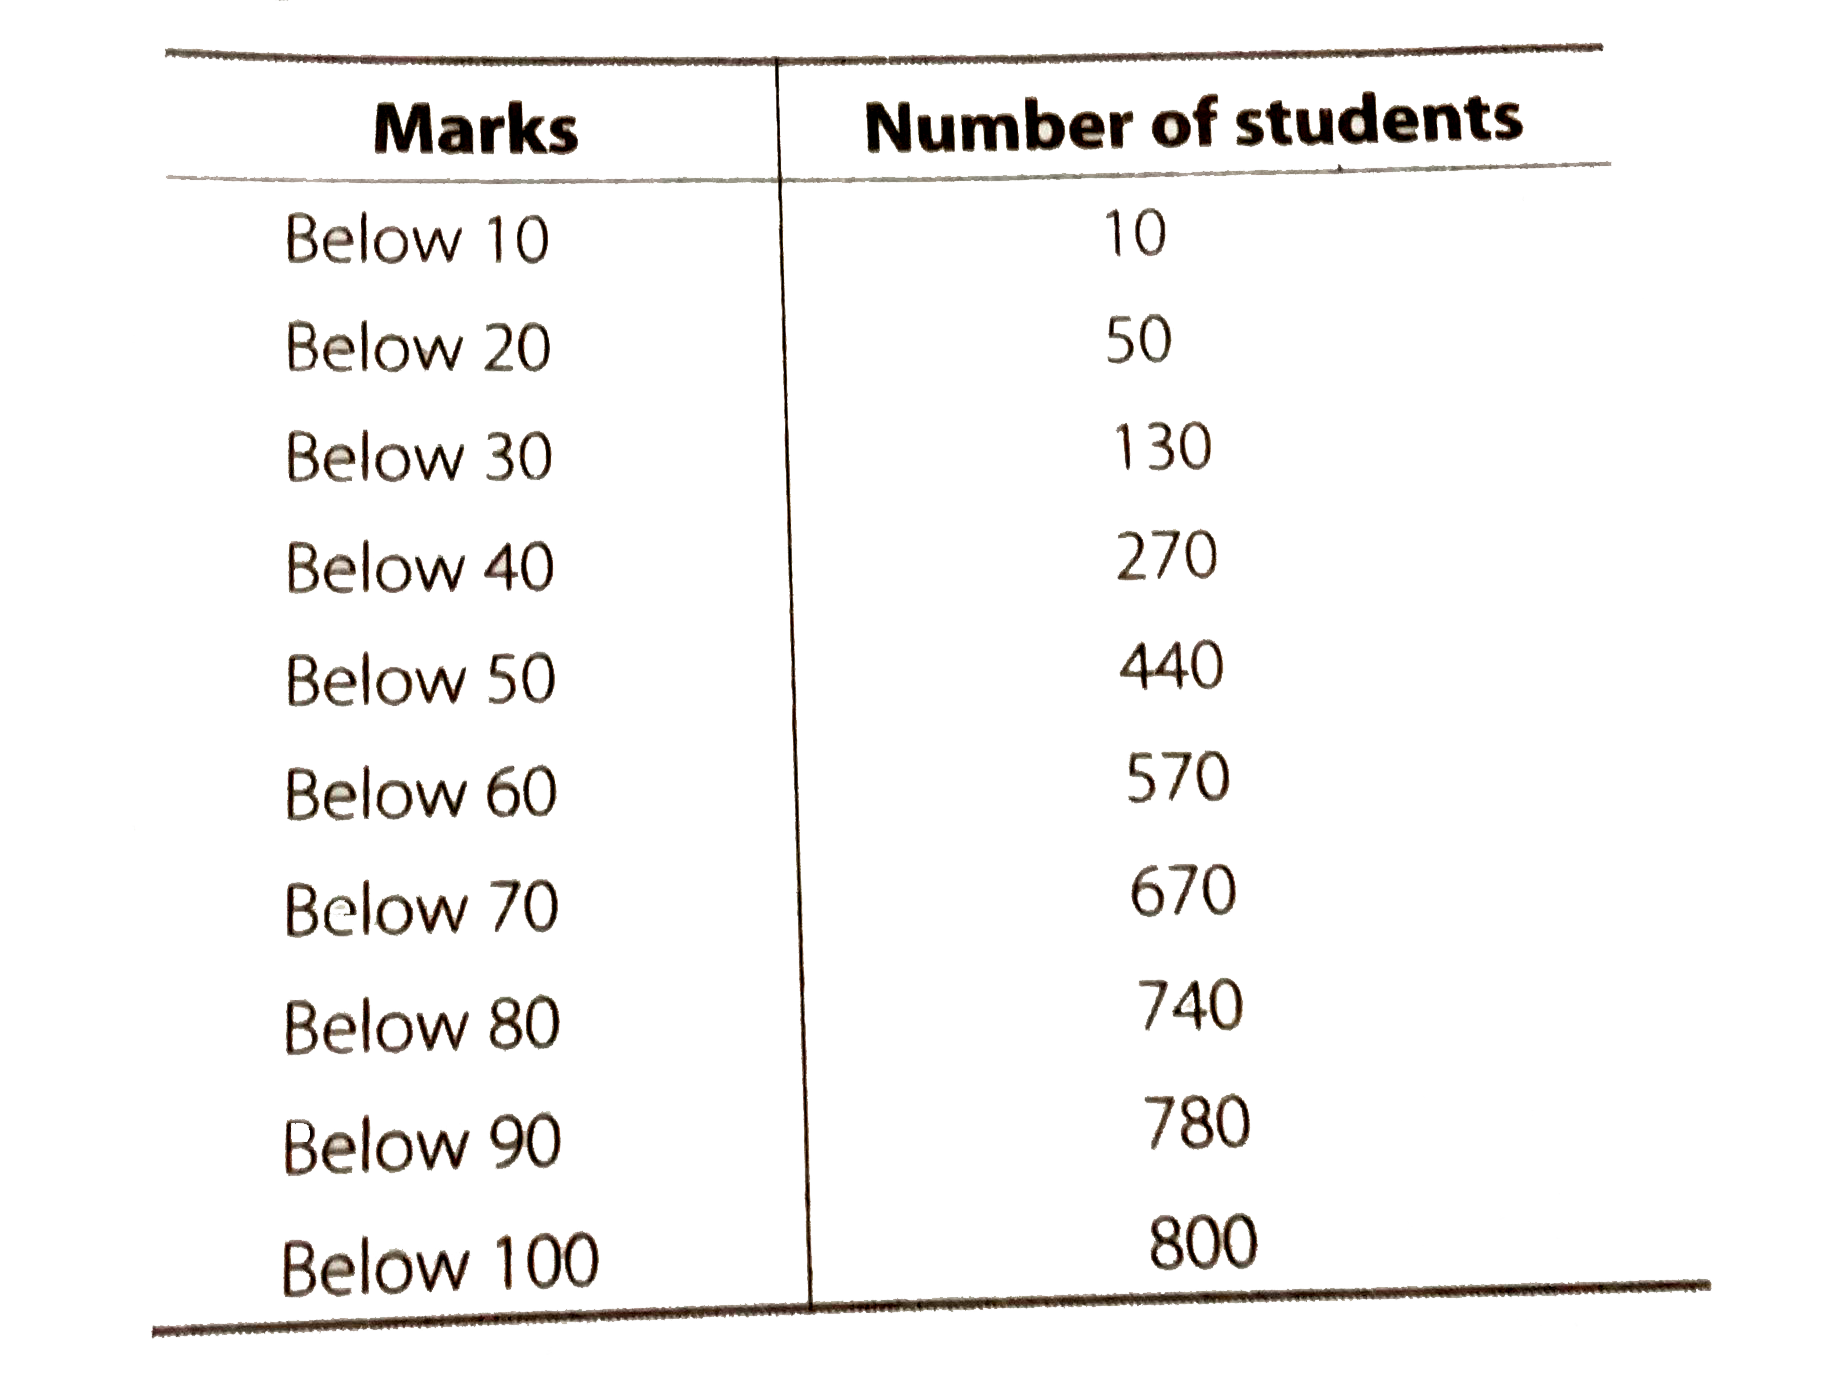
View SolutionThe following table show tha cumulative frequency distribution of marks of 800 students in an examination.

Construct a frequency distribution table for the data above.
View SolutionThe marks scored by 750 students in an examination are given in the form of a frequency distribution table. Marks 600−640,640−680,680−720and720−760,760−800,800−840,840−880 No. of Students: 16 45 156 284 172 59 18 Represent this data in the form of a histogram and construct a frequency polygon.
View SolutionA cumulative frequency distribution is given below. Convert this into a frequency distribution table. Marks Below 45 Below 60 Below 75 Below 90 Below 105 Below 120 No. of Students 0 8 23 48 85 116
View SolutionConsider the marks, out of 100, obtained by 50 students of a class given in the table.

Draw a frequency polygon corresponding to this frequency distribution table using histogram.
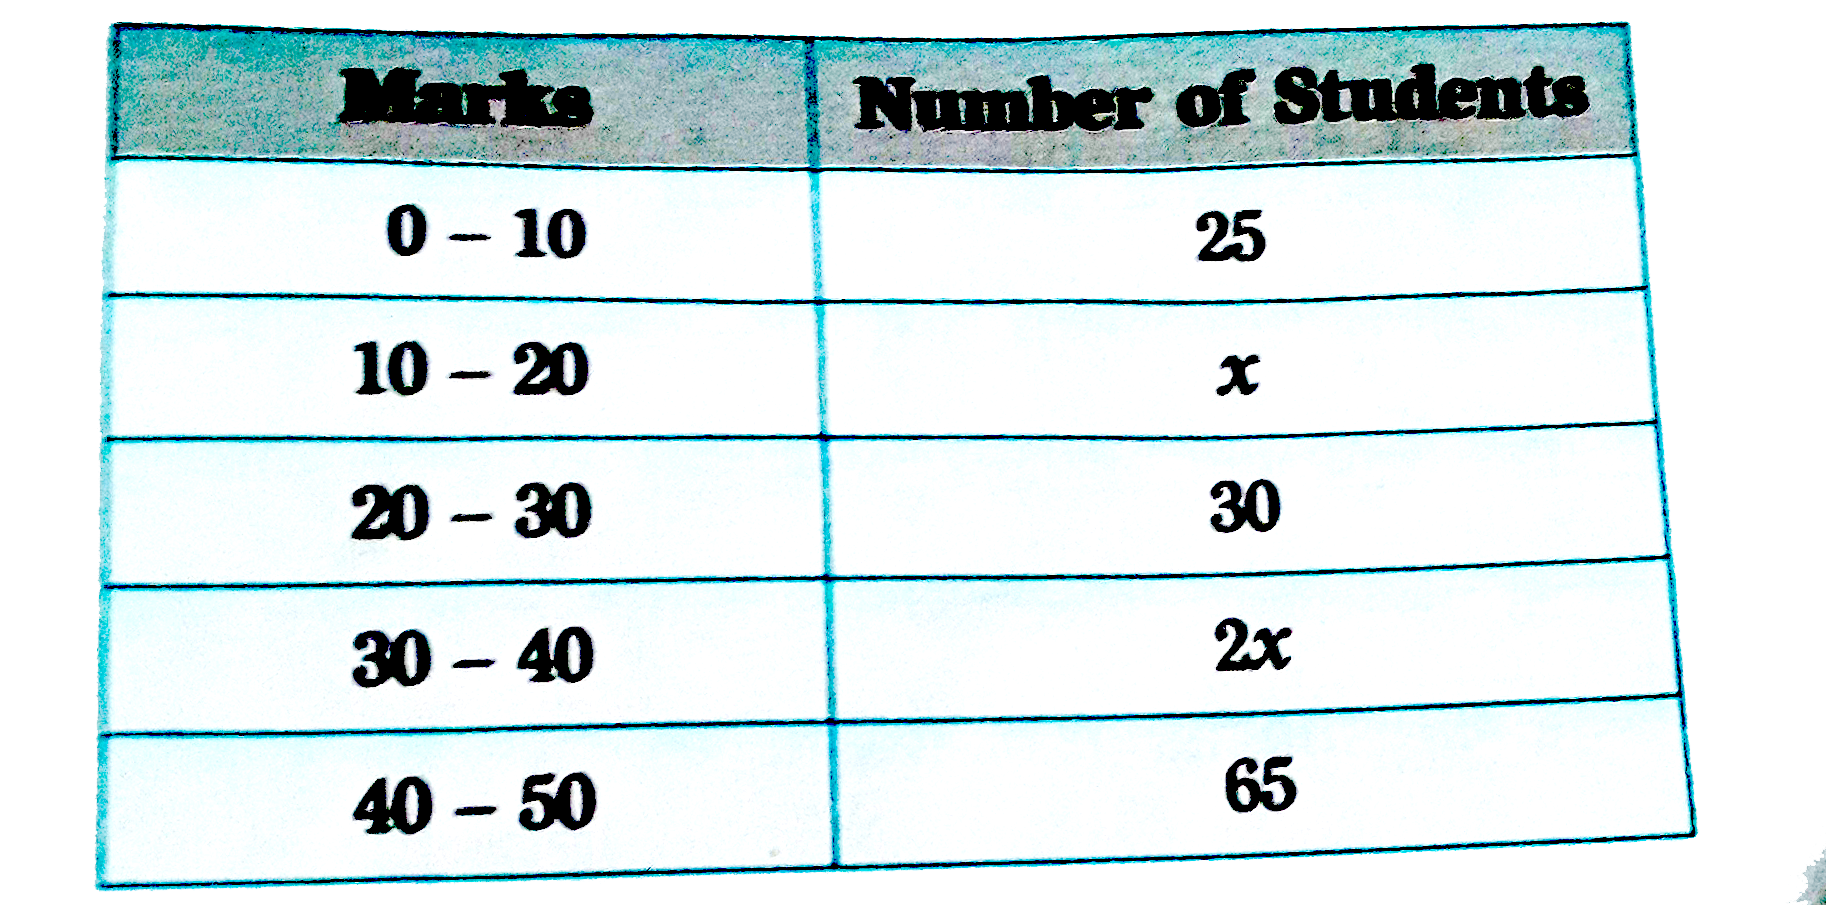
View SolutionThe following frequency distribution table shows marks obtained by 180 students in Mathematics examination :

Find the value of x.
Also draw a histogram representing the above informations.
View SolutionThe marks obtained out of 50, by 102 students in a Physics test are given in the frequency table below: Marks (x) : 15 20 22 24 25 30 33 38 45 Frequency (f) : 5 8 11 20 23 18 13 3 1 Find the average number of marks.
View Solution
