The following table gives the distribution of total household expenditure (in rupees) of manual workers in a city. Expenditure: (in Rs.) 100-150 150-200 200-250 250-300 300-350 350-400 400-450 450-500 Frequency: 24 40 33 28 30 22 16 7 Find the average expenditure (in Rs.) per household.
d1=x1−275
u1=50x1−275
Let the assumed mean be,
A=275
h=50
Mean=A+h×∑f1u1N
=275+50×−35200
=266.25
Topper's Solved these Questions
Similar Questions
The following table gives the distribution of total household expenditure (in rupees) of manual workers in a city. Expenditure (in rupees) (xi) Frequency (fi) 100-150 24 150-200 40 200-250 33 250-300 28 300-350 30 350-450 22 400-450 16 450-500 7 Find the average expenditure (in rupees) per household.
View SolutionThe following data gives the distribution of total household expendilture ( in Rs.) of workers is a city :

Find the average expenditure which is being done by maximum number of manual workers.
View Solution
Knowledge Check
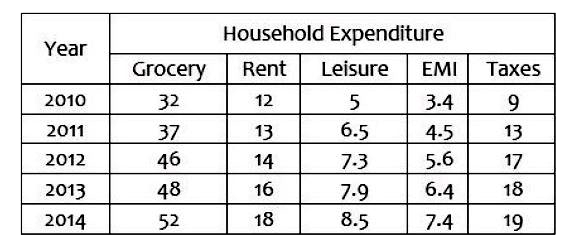
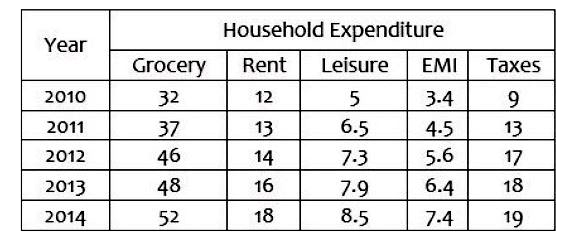
Study the following table and answer the questions based on it Below is the Household Expenditure (in Thousand Rupees) per annum.

What is the average spending on Leisure per annum ?
A. Rs. 7,040
B. Rs. 6,500
C. Rs. 7,100
D. Rs. 7,400ABBCCADDStudy the following table and answer the questions based on it Below is the Household Expenditure (in Thousand Rupees) per annum.

What is the total Husehold Expenditure for the year 2012 ?
A. Rs. 89,900
B. Rs. 87,120
C. Rs. 89,100
D. Rs. 88,200ABBDCCDA
The following table gives the daily income of ten workers in a factory. Find the arithmetic mean.
WorkersABCDEFGHIJDaily Income(in Rs.)120150180200250300220350370260
View SolutionThe following table gives the daily income of ten workers in a factory. Find the arithmetic mean.
WorkersABCDEFGHIJDaily Income(in Rs.)120150180200250300220350370260
View SolutionThe table below shows the daily expenditure on food of 25 households in a locality.
Dail expenditure (in Rs)100−150150−200200−250250−300300−350Number of households451222
Find the mean daily expenditure on food by suitable method.
View SolutionThe cost of 30 mangoes is less then cost of 40 mangoes by Rs 50. Find the cost of 50 mangoes in (Rs) (a)400 (b) 300 (c)250 (d) 350
View SolutionThe monthly profits (in Rs.) of 100 shops are distributed as follows: Profits per shop: 0-50 50-100 100-150 150-200 200-250 250-300 No. of shops: 12 18 27 20 17 6 Draw the frequency polygon for it.
View SolutionWe have the following data on the monthly expenditure on food (in rupees) for 30 households in a locality.

(i) Obtain a frequency distribution using following class intervals:
100-150, 150-200, 200-250, 250-300, 300-350
(ii) What percentage of households spends less than Rupees 250 per month and what percentage of households spends more than Rupess 200 per month?
View Solution
