The following distribution gives the daily income of 50 workers of a factory.Convert the distribution above to a less than type cumulative frequency distribution, and draw its ogive.
The representation of cumulative frequency distribution graphically is known as a cumulative frequency curve or an ogive.
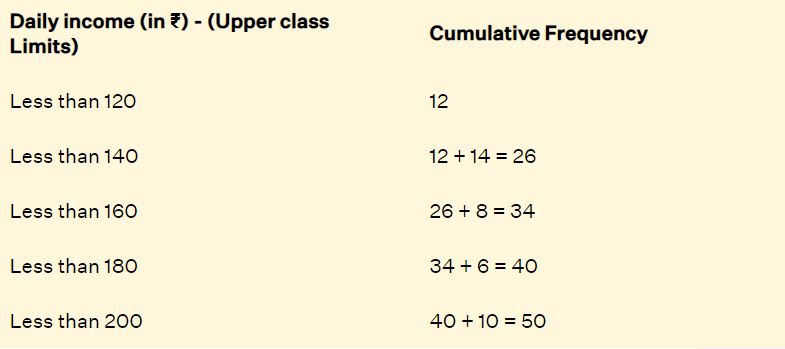
The frequency distribution table of less than type is as follows:

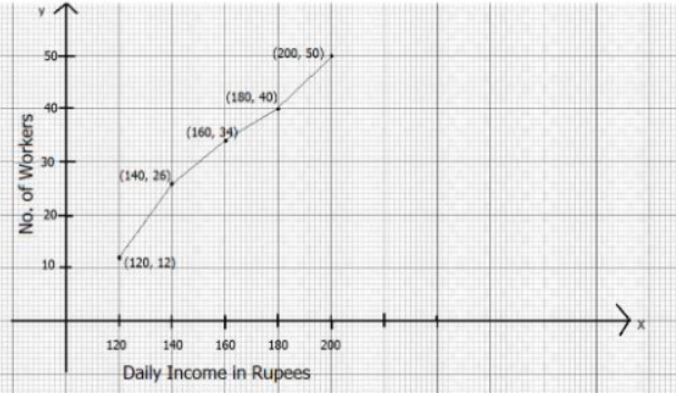
Taking upper-class limits of class intervals on the x-axis and their respective frequencies on the y-axis, its ogive can be drawn as follows:

Topper's Solved these Questions
- BOOK - NCERT ENGLISHCHAPTER - STATISTICSEXERCISE - Exercise 14.37videos
STATISTICS
- BOOK - NCERT ENGLISHCHAPTER - STATISTICSEXERCISE - EXERCISE 14.26videos
STATISTICS
- BOOK - NCERT ENGLISHCHAPTER - STATISTICSEXERCISE - EXERCISE 14.19videos
STATISTICS
- BOOK - NCERT ENGLISHCHAPTER - SOME APPLICATIONS OF TRIGONOMETRYEXERCISE - SOLVED EXAMPLES7videos
SOME APPLICATIONS OF TRIGONOMETRY
- BOOK - NCERT ENGLISHCHAPTER - SURFACE AREAS AND VOLUMESEXERCISE - Exercise 13.39videos
SURFACE AREAS AND VOLUMES
Similar Questions
The following distribution gives the daily income of 60 workers of a factory. Convert the distribution above to a less than type cumulative frequency distribution, and draw its ogive.
View SolutionThe following distribution gives the daily income of 50 workers of a factory: Daily income (in Rs): 100-120 120-140 140-160 160-180 180-200 Number of workers: 12 14 8 6 10 Convert the above distribution to a less than type cumulative frequency distribution and draw its ogive.
View Solution
Knowledge Check
- Question 1 - Select One
In 'Less than' cumulative frequency distribution the omitted limit is
ALowerBUpperCMiddleDNone of these
The following distribution gives the daily income of 50 workers of a factory: Daily income (in Rs): 100-120 120-140 140-160 160-180 180-200 Number of workers: 12 14 8 6 10 Convert the above distribution to a less than type cumulative frequency distribution and draw its ogive.
View SolutionDraw a less than ogive for the following frequency distribution.
View SolutionDraw a 'less than' give for the following frequency distribution :
 View Solution
Draw a 'less than' ogive for the following frequency distribution:
View SolutionConvert the following cumulative frequency distribution into a simple frequency distribution
 View Solution
Convert the following cumulative frequency distribution into a simple frequency distribution
 View Solution
The following table gives production yield per hectare of wheat of 100 farms of a village.

Change the distribution to a more than type distribution, and draw its ogiveView Solution

