The following frequency distribution gives the monthly consumption of electricity of 68 consumers of a locality . Find the mean of the data
Monthly consumption(in units)Number of consumers65−85485−1055105−12513125−14520145−16514165−1858185−2054Solution in Telugu
The correct Answer is:135.1
Step by step video, text & image solution for The following frequency distribution gives the monthly consumption of electricity of 68 consumers of a locality . Find the mean of the data {:("Monthly consumption(in units)","Number of consumers"),(65-85,4),(85-105,5),(105-125,13),(125-145,20),(145-165,14),(165-185,8),(185-205,4):} by Maths experts to help you in doubts & scoring excellent marks in Class 10 exams.
Topper's Solved these Questions
- BOOK - VGS PUBLICATION-BRILLIANTCHAPTER - STATISTICSEXERCISE - EXERCISE 14 .42videos
STATISTICS
- BOOK - VGS PUBLICATION-BRILLIANTCHAPTER - STATISTICSEXERCISE - EXERCISE146videos
STATISTICS
- BOOK - VGS PUBLICATION-BRILLIANTCHAPTER - STATISTICSEXERCISE - EXERCISE 14 .26videos
STATISTICS
- BOOK - VGS PUBLICATION-BRILLIANTCHAPTER - SIMILAR TRIANGLES EXERCISE - CREATIVE BITS FOR CCE MODEL EXAMINATION90videos
SIMILAR TRIANGLES
- BOOK - VGS PUBLICATION-BRILLIANTCHAPTER - SUMMATIVE ASSESSMENTEXERCISE - SUMMATIVE ASSESSMENT61videos
SUMMATIVE ASSESSMENT
Similar Questions
The following distribution gives the daily income of 50 workers of a factory .
Daily (in Rupees)Number of workers250−30012300−35014350−4008400−4506450−50010
Convert the distribution above to a lessthan type cumulative frequency distribution, and draw its ogive .11:04View SolutionThe mean value can be calculated from both ungrouped and grouped date . Which one you think is more accurate ? Why ?
07:39View SolutionThe following table shows the ages of the patients admitted in a hospital during a year :
Age (in years)Number of patients5−15615−251125−352135−452345−551455−655
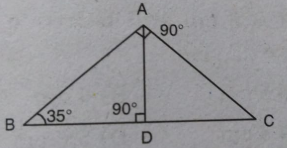
Find the mode and the mean of the data given above . Copmare and interpret the two measures of central tendency .08:21View SolutionFrom the figure ,∠DAC……….
 07:45View Solution
Ramu says, "If log10x=0, value of x=0". Do you agree with him ? Give reason.
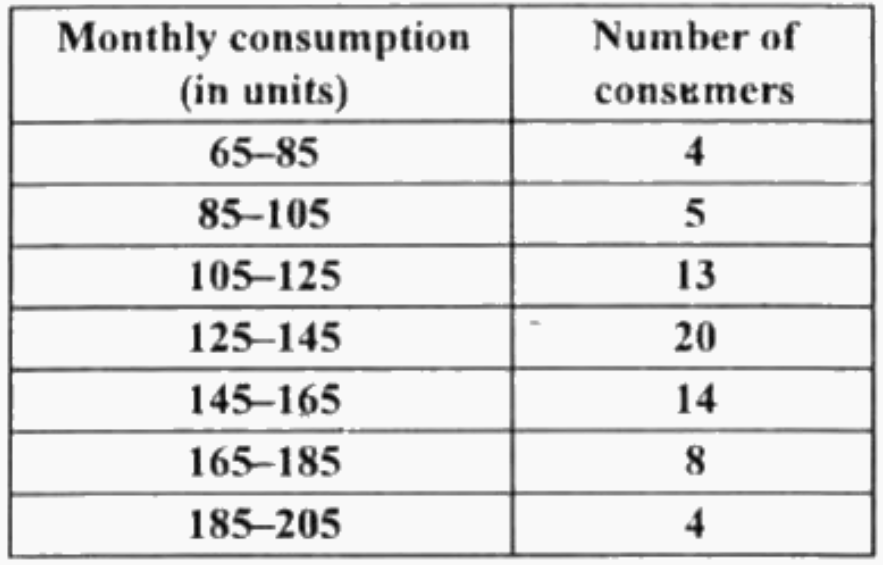
View SolutionThe following frequency distribution gives the monthly consumption of electricity of 68 consumers of a locality. Find the median, mean and mode of the data and compare them.
 11:04View Solution
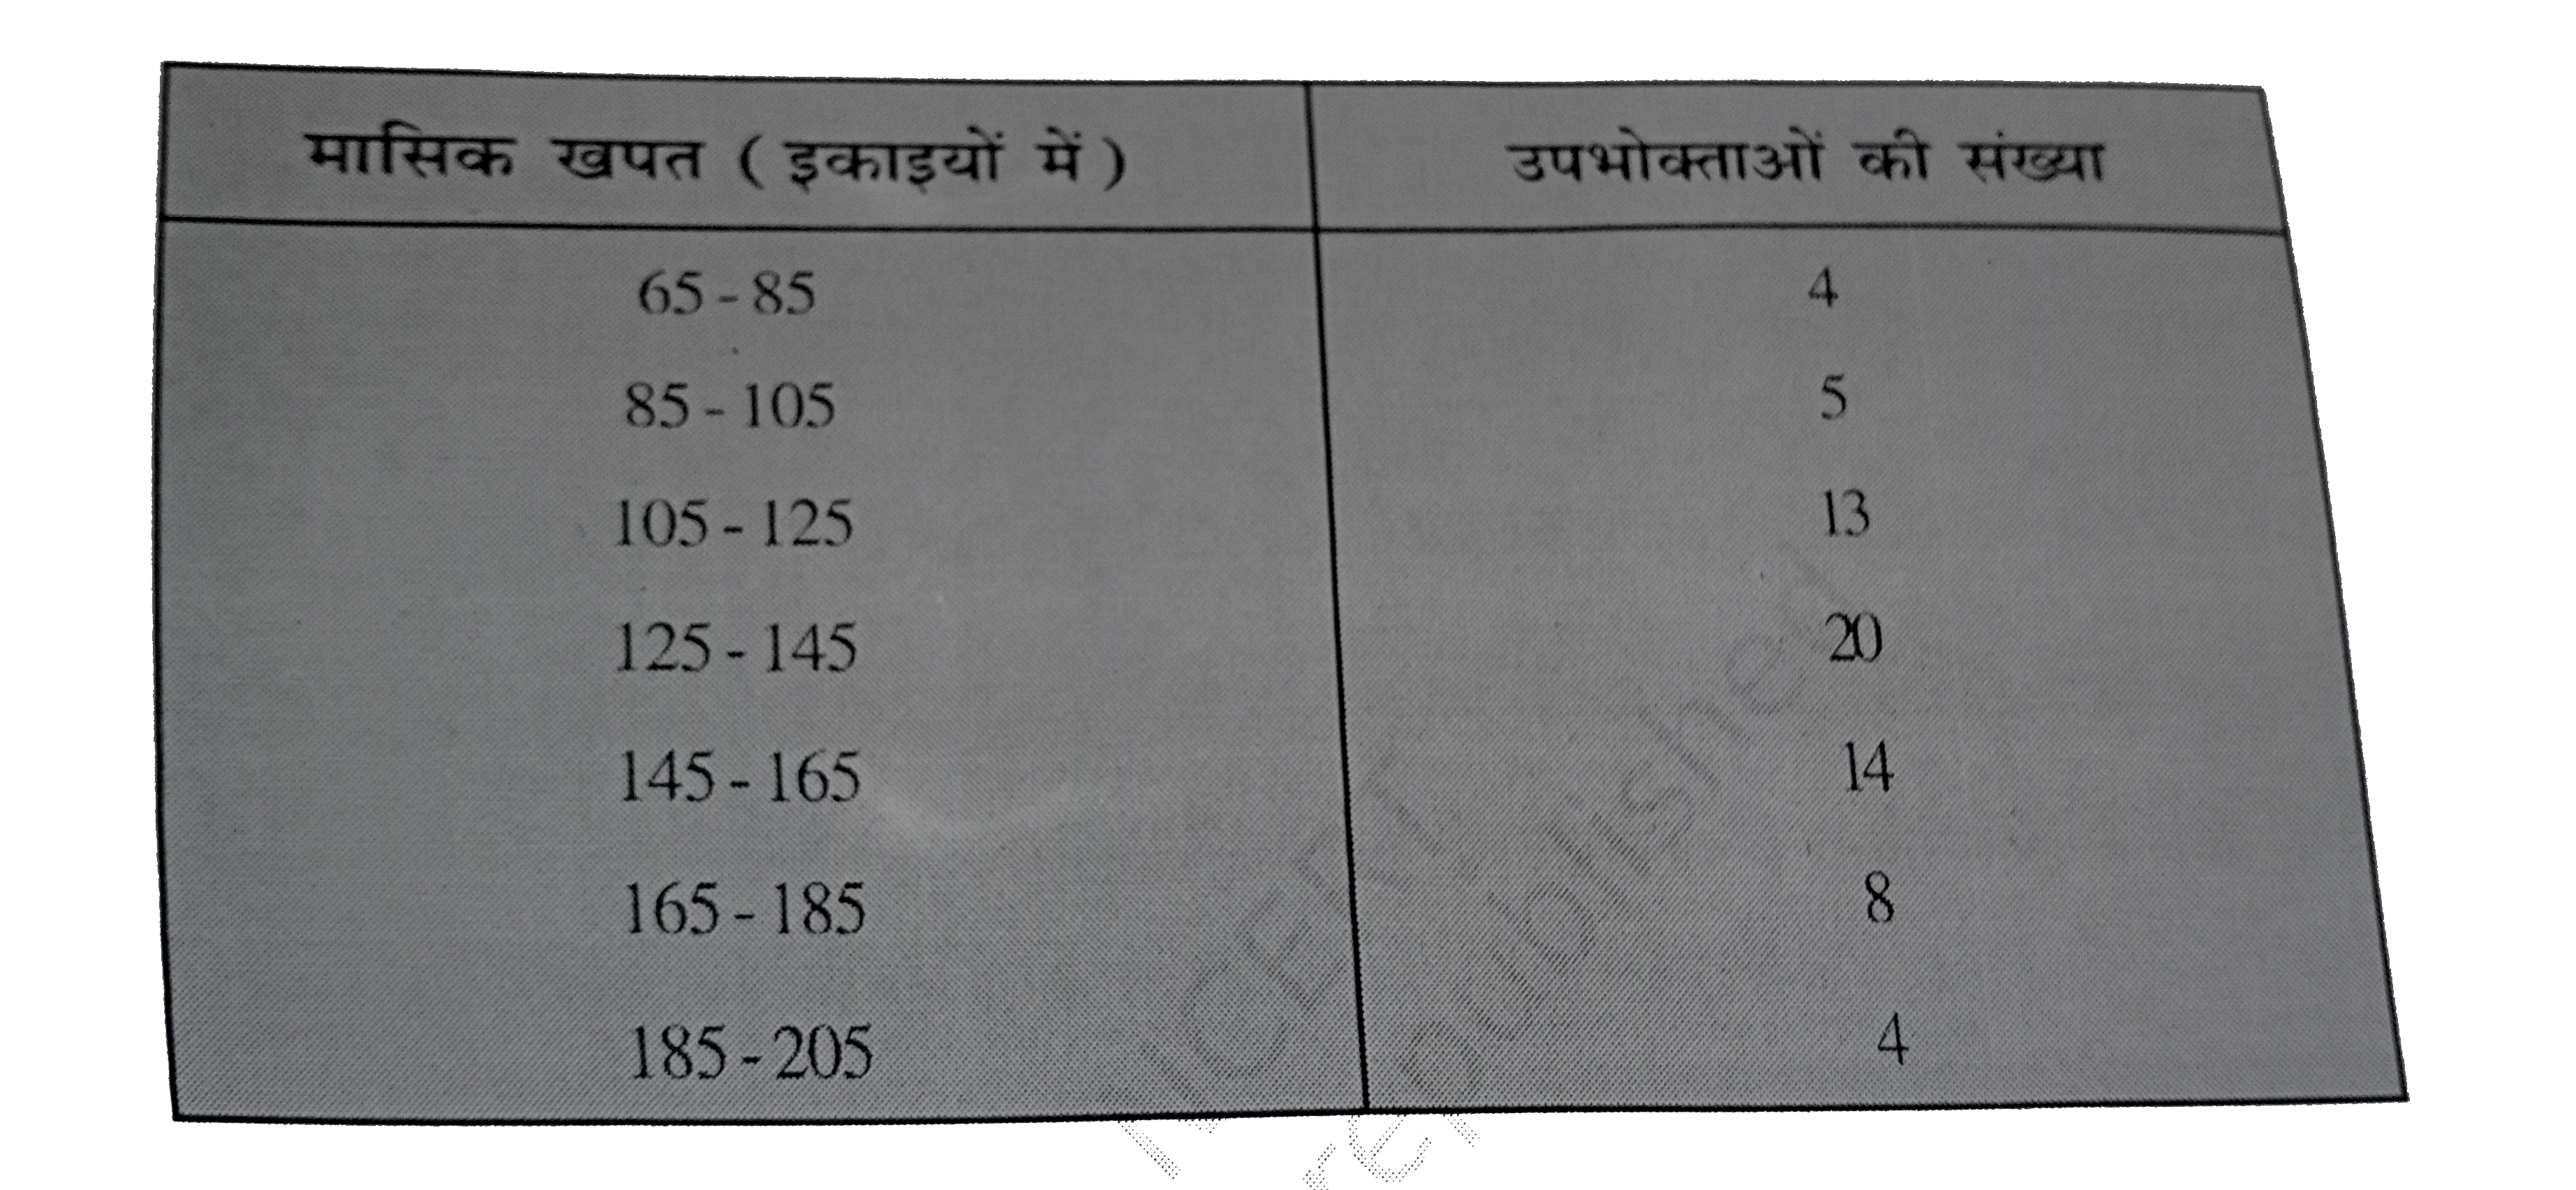
निम्नलिखित बारंबारता बंटन किसी मोहल्ले के 68 उपभोक्ता की बिजली की मासिक खपत दर्शाता हैं आंकड़ों के माध्य, माध्यक और बहुलक ज्ञात कीजिए। इनकी तुलना कीजिए।
 .02:33View Solution
निम्नलिखित बारम्बारता बंटन किसी मोहल्ले के 68 उपभोक्ताओं की बिजली की मासिक खपत दर्शाता है ।

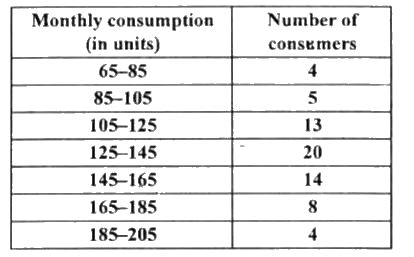
इन आँकड़ों के माधयक तथा माध्य ज्ञात कीजिए ।01:54View SolutionThe following frequency distribution gives the monthly consumption of electricity of 68 consumers of a locality. Find the median, mean and mode of the data and compare them.
 View Solution
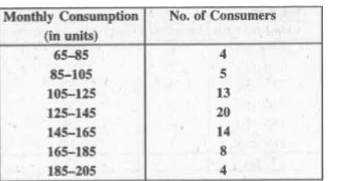
The following distribution gives the monthly consumption of consumers of a locality. Find the median of the distribution
 07:58View Solution
The following frequency distribution gives the monthly consumption of electricity of 68 consumers of a locality. Find the median, mean and mode of the data and compare them.
 10:05View Solution
निम्न आँकड़ों के लिए बहुलक ज्ञात कीजिए |
(मासिक खपत (इकाइयों में),उपभोक्ताओं की संख्या),( 65−85, 4),( 85−105, 5),( 105−125, 13),( 125−145, 20),( 145−165, 14),( 165−185, 8),( 185−205, 4):}View SolutionFind the mode of the given data 15,11,10,8,15,18,17,15
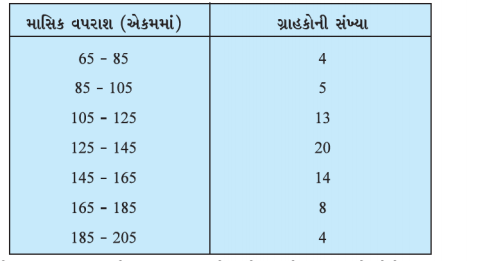
View SolutionThe following frequency distribution gives the monthly comsumption of electricity of 68 consumers of a locality. Find the median, mean and mode of the data and compare them.
 02:03View Solution
The following frequency distribution gives the monthly consumption of electricity of 68 consumers of a locality. Find the median, mean and mode of the data and compare them. Monthly consump- 65-85 85-105 105-125 125-145 145-165 165-185 185-205 No. of consumers: 4 5 13 20 14 8 4
01:15View Solution

