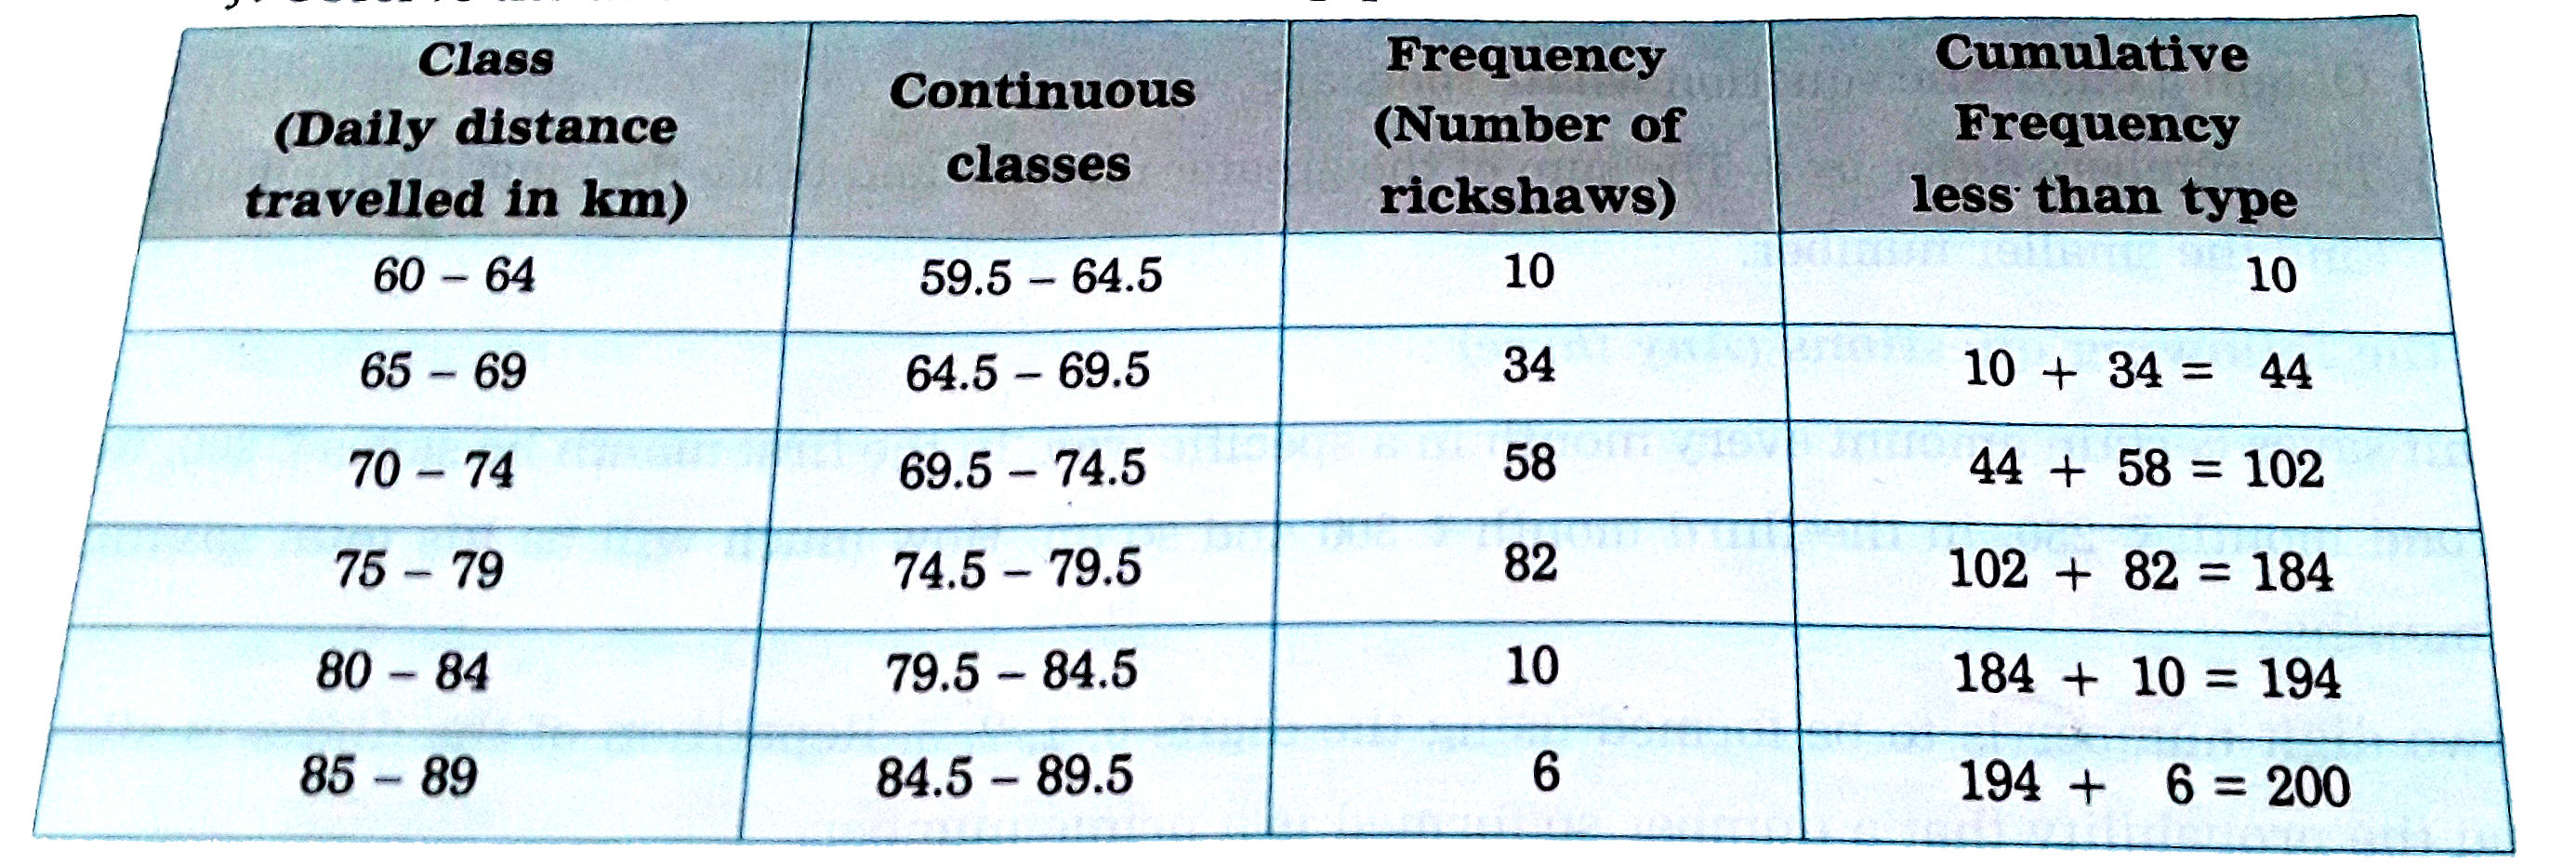
The following frequency distribution table shows the distances travelled by some rickshaws in a day. Observe the table and answer the following question:

(a) which is the modal class? Why?
(b) which is the median class and why?
(c) write the cumulative frequency (c.f.) of the class preceding the median class.
(d) what is the class interval (h) to calculate median?
The correct Answer is:(a) 74.5 - 79.5; becaues the maximum frequency is 82. (b) 69.5−74,5;N2 lies in this class ( c ) 44 (d) 5.
Step by step video & image solution for The following frequency distribution table shows the distances travelled by some rickshaws in a day. Observe the table and answer the following question: (a) which is the modal class? Why? (b) which is the median class and why? (c) write the cumulative frequency (c.f.) of the class preceding the median class. (d) what is the class interval (h) to calculate median? by Maths experts to help you in doubts & scoring excellent marks in Class 10 exams.
Topper's Solved these Questions
Similar Questions
The following frequency distribution table shows the distances travelled by some rickaws in a day .Observe the table and answer the following :

a. Which is the modal class ? Why ?
b. Which is the medium class and why ?
c. Write the cumulative frequency (C.F ) of the preceding the medium class .
d. what is the class interval (h) calculate medium ?View SolutionConsider the following frequency distribution
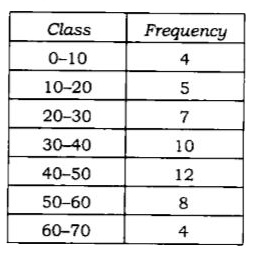
What is the median class?
 View Solution
Knowledge Check
- Question 1 - Select One
In the following frequency distribution, find the median class.

What is the value of model marks ?A155.25B156.25C157.25D159.25 - Question 2 - Select One
In the following frequency distribution, find the median class.

What is the value of median height ?A145.67B157.67C155.83D159.67 - Question 3 - Select One
In the following frequency distribution, find the median class.

What is the value of mean height ?A155.625B156.250C158.500D159.275
Observe the following frequency distribution table. It shows the distances travelled by 60 public transport buses in a day. Find the median of the distance travelled.
 View Solution
For the following frequency distribution

The upper limit of median class isView SolutionIn the following frequency distribution, what is the upper limit of the median class ?
 View Solution
Write the median class of the following distribution:
 View Solution
Find the median class of the following distribution:
 View Solution

