The following graph gives the information about the number of railway tickets sold for different cities on a railway ticket counter between 6.00 am to 10.00 am. Read the bar graph and answer the following questions.
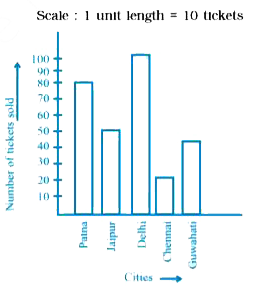
How many tickets were sold in all?
Step by step video & image solution for The following graph gives the information about the number of railway tickets sold for different cities on a railway ticket counter between 6.00 am to 10.00 am. Read the bar graph and answer the following questions. How many tickets were sold in all? by Maths experts to help you in doubts & scoring excellent marks in Class 6 exams.
Updated on:21/07/2023Topper's Solved these Questions
Similar Questions
The following graph gives the information about the number of railway tickets sold for different cities on a railway ticket counter between 6.00 am to 10.00 am. Read the bar graph and answer the following questions.
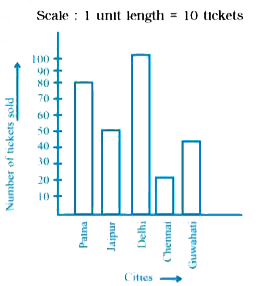
For which city were the minimum number of tickets sold?
View SolutionThe following graph gives the information about the number of railway tickets sold for different cities on a railway ticket counter between 6.00 am to 10.00 am. Read the bar graph and answer the following questions.
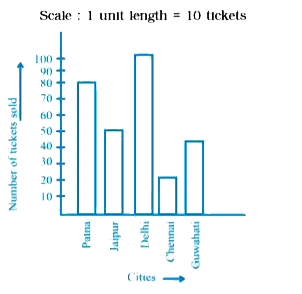
For which city were the maximum number of tickets sold?
View Solution
Knowledge Check
Study the graph carefully and answer the following questions.
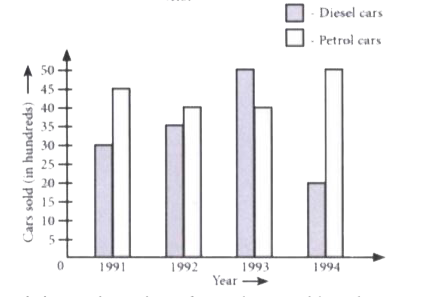
How many cars were sold during the year 1991?A9000B6500C7500D7000Study the graph carefully and answer the following questions.
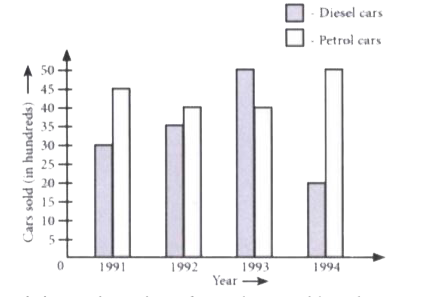
How many more Diesel cars were sold in 1991 than in 1994?A500B1500C1000D2000
The following graph gives the information about the number of railway tickets sold for different cities on a railway ticket counter between 6.00 am to 10.00 am. Read the bar graph and answer the following questions.
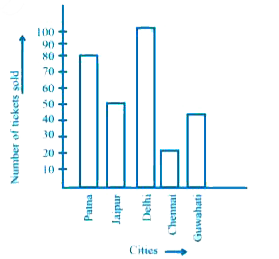
Fill in the blanks:
Number of tickets sold for Delhi and Jaipur together exceeds the total number of tickets sold for Patna and Chennai by _____
View SolutionThe following graph gives the information about the number of railway tickets sold for different cities on a railway ticket counter between 6.00 am to 10.00 am. Read the bar graph and answer the following questions.
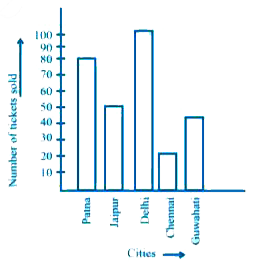
Name the cities for which the number of tickets sold is more than 20.
View SolutionLook at the bar graph and answer the following questions.
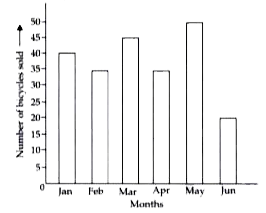
In which month 40 bicycles were sold?
View SolutionLook at the bar graph and answer the following questions.
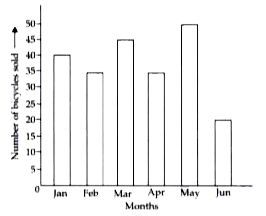
How many less bicycles sold in June than in March?
View SolutionRead the graph and answer the following questions
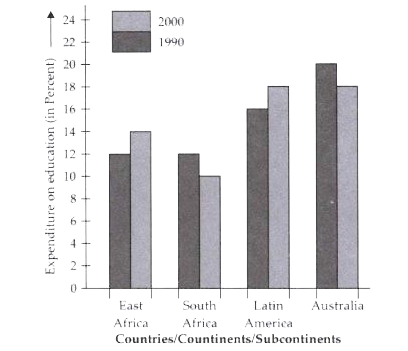
Give a suitable title to bar graph
View SolutionRead the graph and answer the following questions
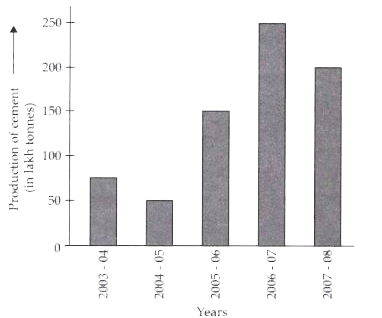
What information is conveyed by the bar graph
View Solution
