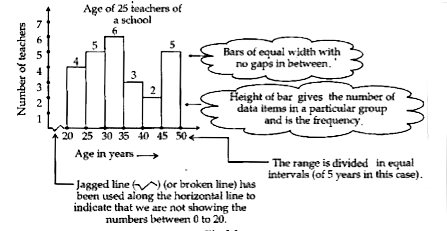
The following graph is another historam (Fig.)

From the bars of this histogram, we can answer the following questions :
(i) How many teachers are of age 45 years or more but less than 50 years?
(ii) How many teachers are of age less than 35 years?Solution in Punjabi
Step by step video & image solution for The following graph is another historam (Fig.) From the bars of this histogram, we can answer the following questions : (i) How many teachers are of age 45 years or more but less than 50 years? (ii) How many teachers are of age less than 35 years? by Maths experts to help you in doubts & scoring excellent marks in Class 8 exams.
Topper's Solved these Questions
- BOOK - NAND LAL PUBLICATIONCHAPTER - DATA HANDLING EXERCISE - EXERCISE-5.12videos
DATA HANDLING
- BOOK - NAND LAL PUBLICATIONCHAPTER - DATA HANDLING EXERCISE - EXERCISE-5.25videos
DATA HANDLING
- BOOK - NAND LAL PUBLICATIONCHAPTER - DATA HANDLING EXERCISE - Think, Discuss and Write2videos
DATA HANDLING
- BOOK - NAND LAL PUBLICATIONCHAPTER - CUBES AND CUBE ROOTSEXERCISE - Sample Paper For Practice18videos
CUBES AND CUBE ROOTS
- BOOK - NAND LAL PUBLICATIONCHAPTER - DIRECT AND INVERSE PROPORTIONSEXERCISE - SAMPLE PAPER FOR PRACTICE ( Fill in the blanks )17videos
DIRECT AND INVERSE PROPORTIONS
Similar Questions
For which of these would you use a histogram to show the data : The number of letters for different areas in a postman’s bag. Give reasons for each
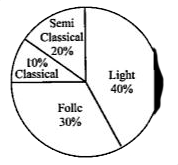
01:37View SolutionA survey was made to find the type of music that a certain group of young people liked in a city. Adjoining pie chart shows the findings of this survey.

Find this pie chart answer the following
(i) If 20 people liked classical music, how many young people were surveyed?
(ii) Which type of music is liked by the maximum number of people?
(iii) If a cassette company were to make 1000 CD's how many of each type would they make?02:11View SolutionWhich form of graph would be appropriate to display the following data
Production of food grains of a state
 02:45View Solution
Cube of a natural number 5 will end with the digit
02:17View SolutionSpeed of moving objects varies inversely to the ________ to cover a certain distance.
05:41View SolutionHow many lines of symmetry does the above figure have ?
02:10View SolutionDetermine the point of symmetry of a regular hexagon.
02:17View SolutionMatch the following Column A to Column B
 02:10View Solution
Match the following Column A to Column B
 03:02View Solution
Match the following Column A to Column B
 03:12View Solution
The inequation represented by the graph given below is :
07:21View SolutionThe inequation that best describes the graph given below is _________
03:13View SolutionThe inequation that best describes the following graph is _________
02:16View SolutionIn the given figure, PQRS is a parallelogram. A and B are the mid-point of ¯¯¯¯¯¯PQ and ¯¯¯¯¯SR respectively. If PS=BR, then the quadrilateral ADBC is a…………………… ,
ltimg src="https://d10lpgp6xz60nq.cloudfront.net/physics_images/PS_MATH_IX_C12_E05_020_Q01.png" width="80%"gt01:47View SolutionMatch the followings (column I with column II)
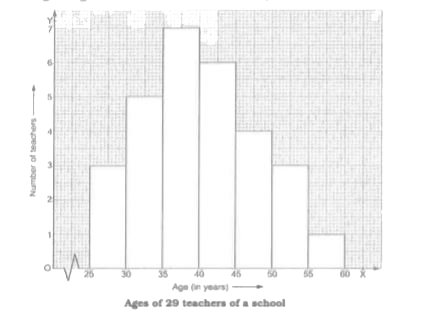
ltimg src="https://d10lpgp6xz60nq.cloudfront.net/physics_images/NCERT_BIO_XI_C03_E01_011_Q01.png" width="80%"gt01:25View SolutionLook at the histogram given below answer the question that follow:

(i) What information in being given by the histogram?
(ii) How many teachers are of age less than 45 years?
(iii) How many teachers are of age 40 years or more but less than 55 years?01:32View Solution
