The following table depicts the maximum temperature on the seven days of a particular week. Study the table and draw a line graph for the same.

Step by step video & image solution for The following table depicts the maximum temperature on the seven days of a particular week. Study the table and draw a line graph for the same. by Maths experts to help you in doubts & scoring excellent marks in Class 8 exams.
Topper's Solved these Questions
- BOOK - RS AGGARWALCHAPTER - INTRODUCTION TO COORDINATE GEOMETRYEXERCISE - EXERCISE B (OBJECTIVE QUESTIONS)7videos
INTRODUCTION TO COORDINATE GEOMETRY
- BOOK - RS AGGARWALCHAPTER - LINEAR EQUATIONSEXERCISE - TEST PAPER-8 (D) (Write .T. for true and .F. for false for each of the following:)1videos
LINEAR EQUATIONS
Similar Questions
Complete the given tables and draw a graph for each.
 View Solution
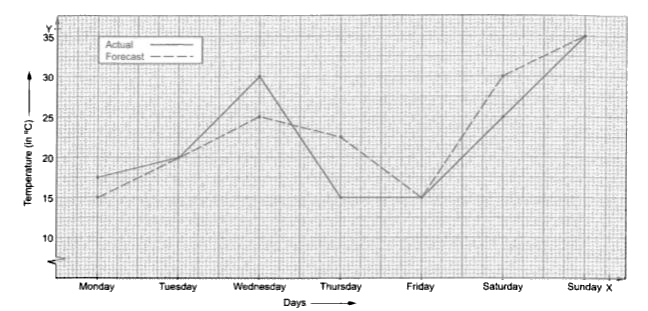
The following line graph shows the temperature forecast and the actual temperature for each day of a week.

Study the above double line graph carefully and answer the questions given below:
(i) On which days was the forecast temperature the same as the actual temperature?
(ii) What was the maximum forecast temperature during the week ?
(iv) On which day did the actual temperature differ the most from the forecast temperature?View Solution
Knowledge Check
- Question 1 - Select One
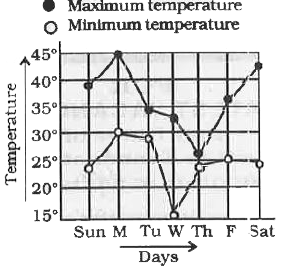
The following graph represents the maximum and minimum temperature recorded every day in a certain week. The day on which the difference between the maximum and minimum temperature was maximum is
 AWednesdayBSaturdayCSundayDMonday
 - Question 2 - Select One
The following table gives zonewise survey report of the people of a country who take coffee. Study the table and answer the questions.

The percentage of people from non-west zone who take coffee 'only once a week' is approximatelyA11B12C13D14 - Question 3 - Select One
Study the following table and select the correct option.
 AII and IIIBI and IICIII and IVDI and IV
Study the following table
 View Solution
Study the following table
 View Solution
Complete the table for drawing the graph. 2x-y=1
View SolutionDraw the line graph for the following table:
 View Solution
The following table gives zonewise survey report of the people of a country who take coffee. Study the table and answer the questions.

The percentage of people of south zone who take coffee at least once a day is close toView Solution

