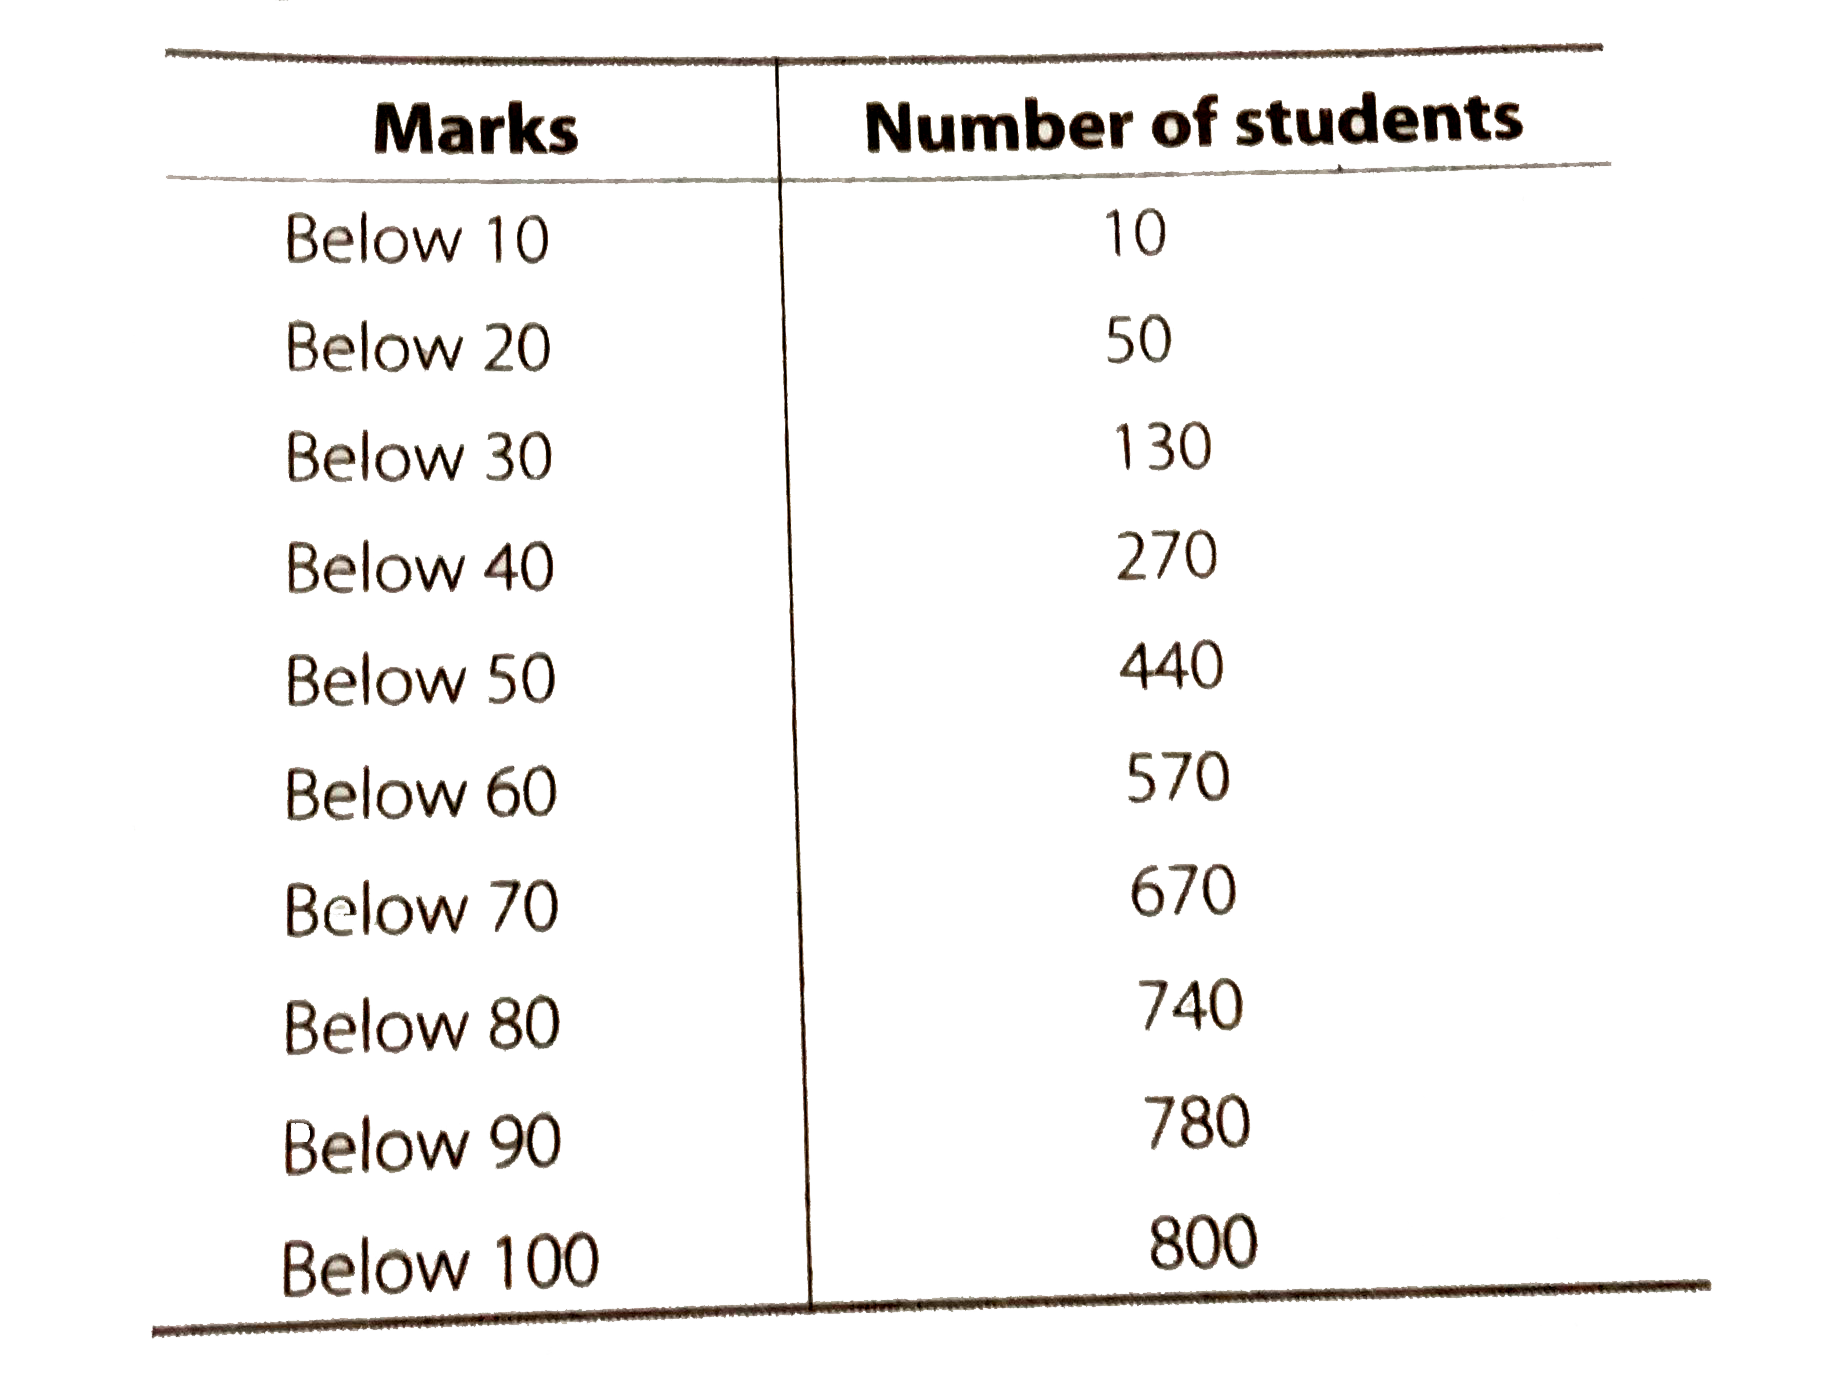
The following table show tha cumulative frequency distribution of marks of 800 students in an examination.

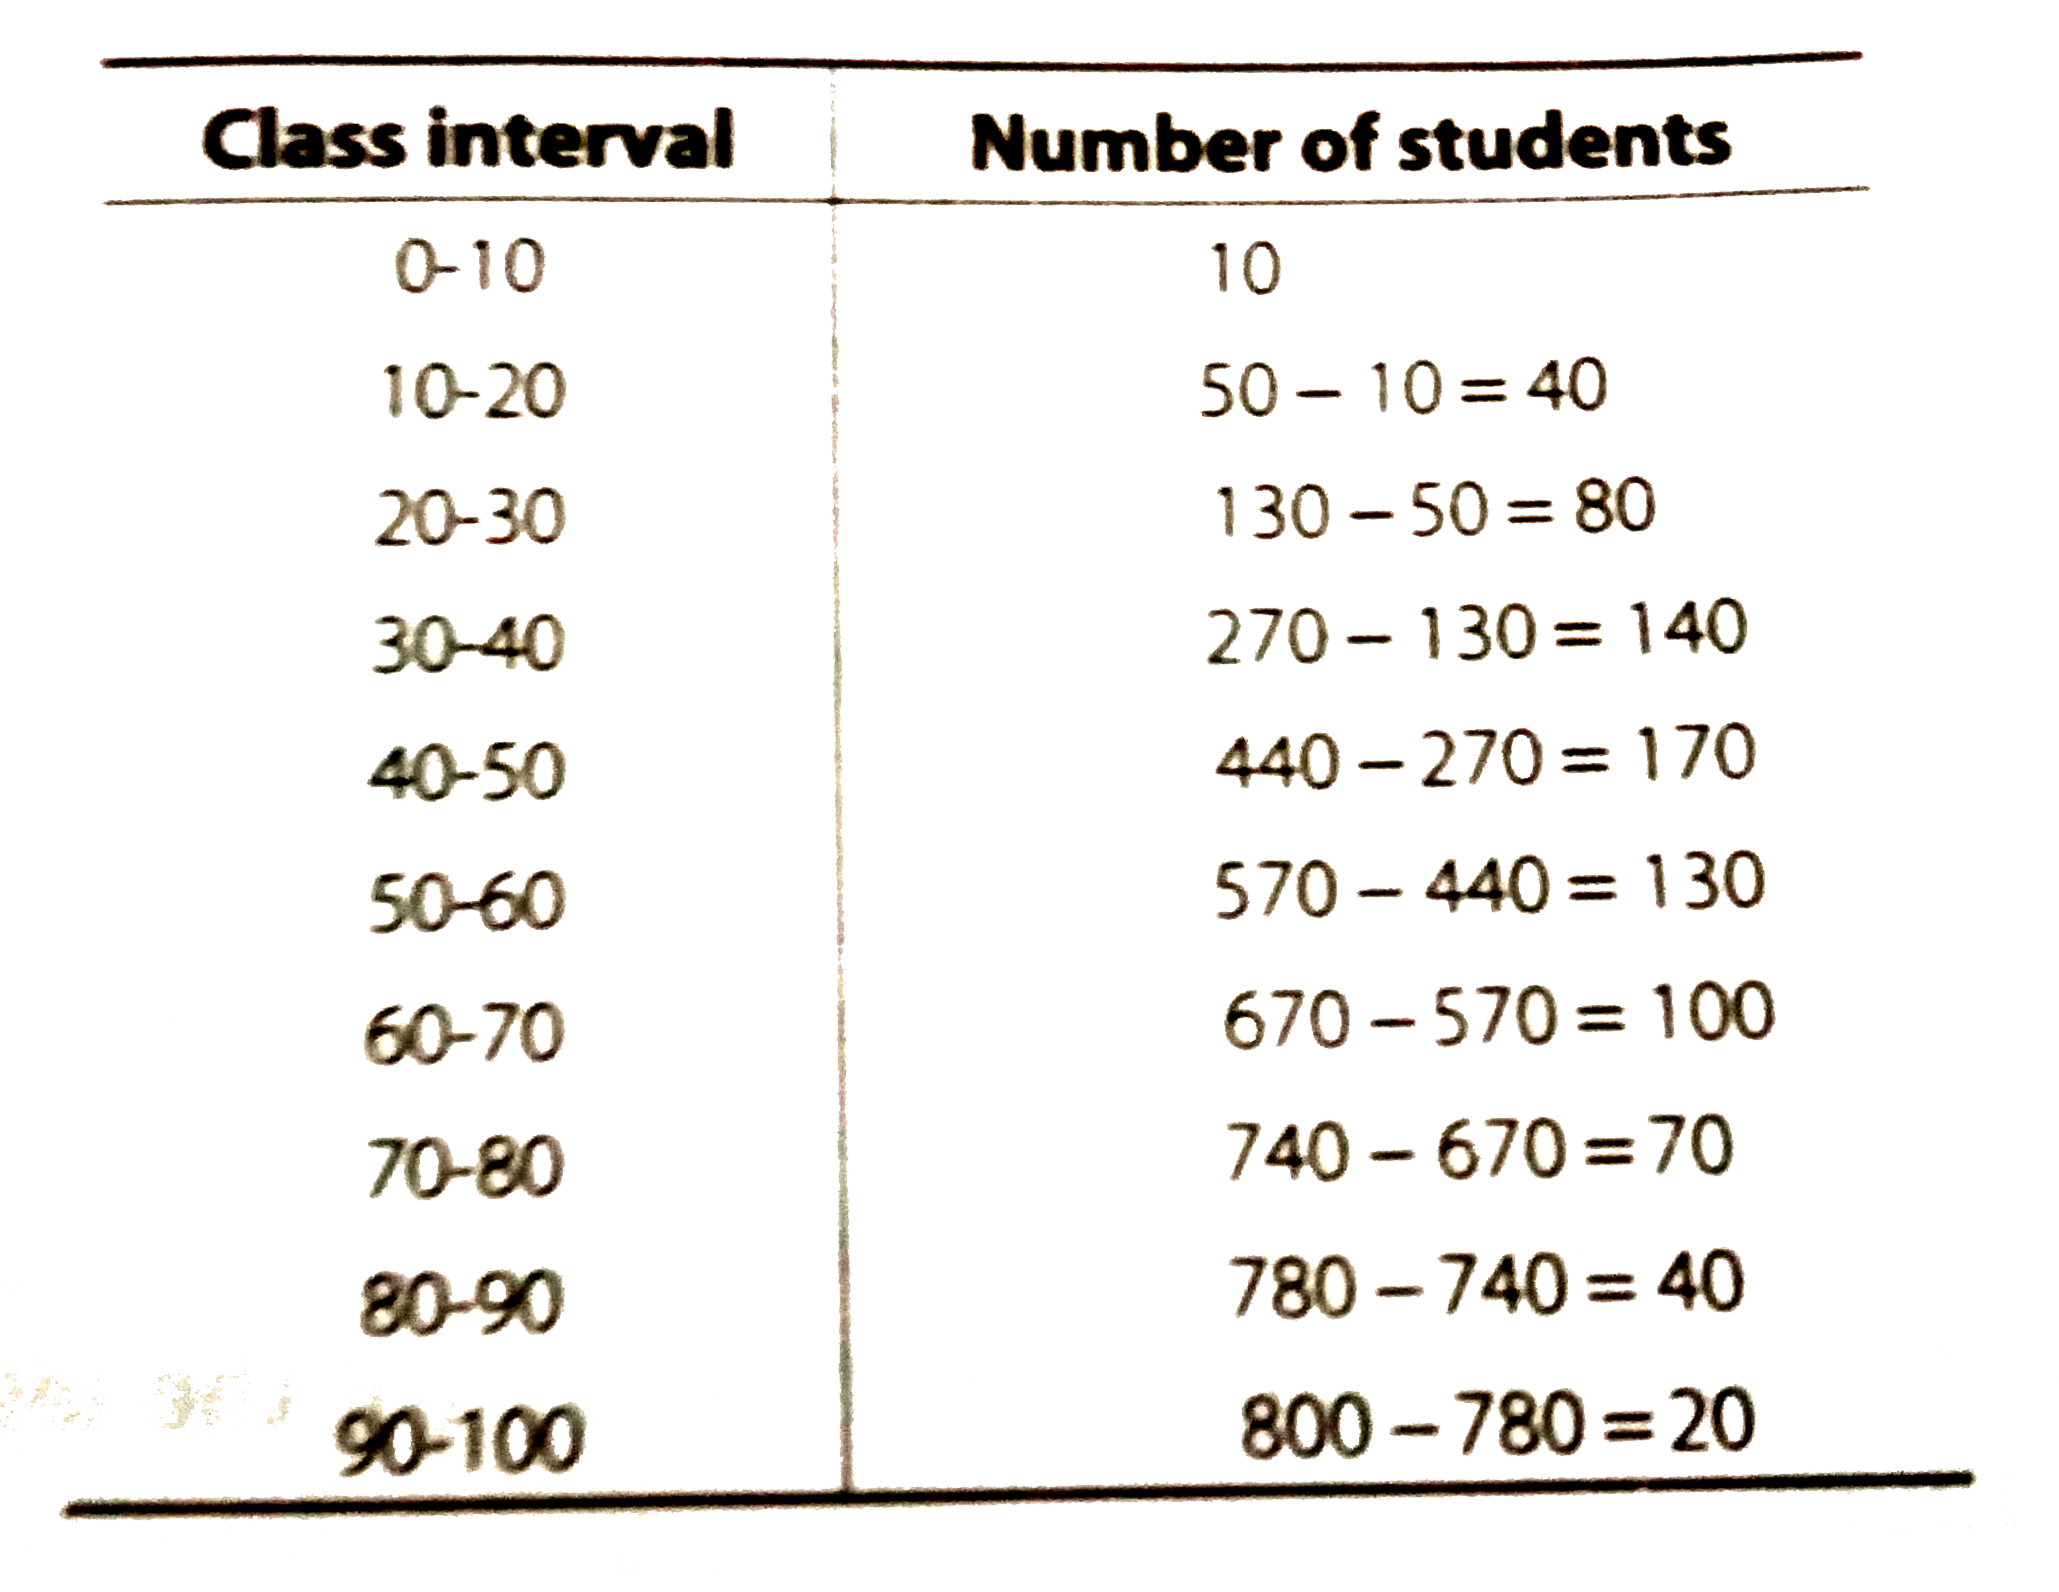
Construct a frequency distribution table for the data above.
Here, we observe that 10 students have scrored marks below 10 i.e. it lies between class interval 0-10. Similarly, 50 students have scored mark below 20. So, 50-10=40 students lies in the interval 10-20 and so on. The table of a frequency distribution for the given data is

Topper's Solved these Questions
- STATISTICS AND PROBABILITYBOOK - NCERT EXEMPLAR ENGLISHCHAPTER - STATISTICS AND PROBABILITYEXERCISE - LONG ASWERS QUESTIONS
14 Videos
- STATISTICS AND PROBABILITYBOOK - NCERT EXEMPLAR ENGLISHCHAPTER - STATISTICS AND PROBABILITYEXERCISE - VERY SHORT ANSWERS QUESTIONS
14 Videos
- REAL NUMBERSBOOK - NCERT EXEMPLAR ENGLISHCHAPTER - REAL NUMBERSEXERCISE - LONG ANSWER TYPE QUESTIONS
5 Videos
- SURFACE AREAS AND VOLUMESBOOK - NCERT EXEMPLAR ENGLISHCHAPTER - SURFACE AREAS AND VOLUMESEXERCISE - LONG ANSWER TYPE QUESTIONS
20 Videos
Similar Questions
Given below is a cumulative frequency distribution showing the mars secured by 50 students of a class

From the frequency distribution table for the data.
View SolutionFrom the frequency distribution table from the following data

View SolutionThe following table shows the frequency distribution of heights of 50 boys: Find the mode of heights
View SolutionConstruct a frequency polygon for the following data:

View SolutionConstruct a frequency polygon for the following data :

View SolutionFind the mode of the following frequency distribution

View SolutionThe mode for the following frequency distribution :

View SolutionFind the mode of the following frequency distribution :

View SolutionFind the mean for the following frequency distribution :

View SolutionThe following is the distribution of weights (in kg) of 40 persons.

Construct a cumulative frequency distribution (of the less than type) table for the data above.
View Solution
