Weekly income of 600 families is tabulted below.
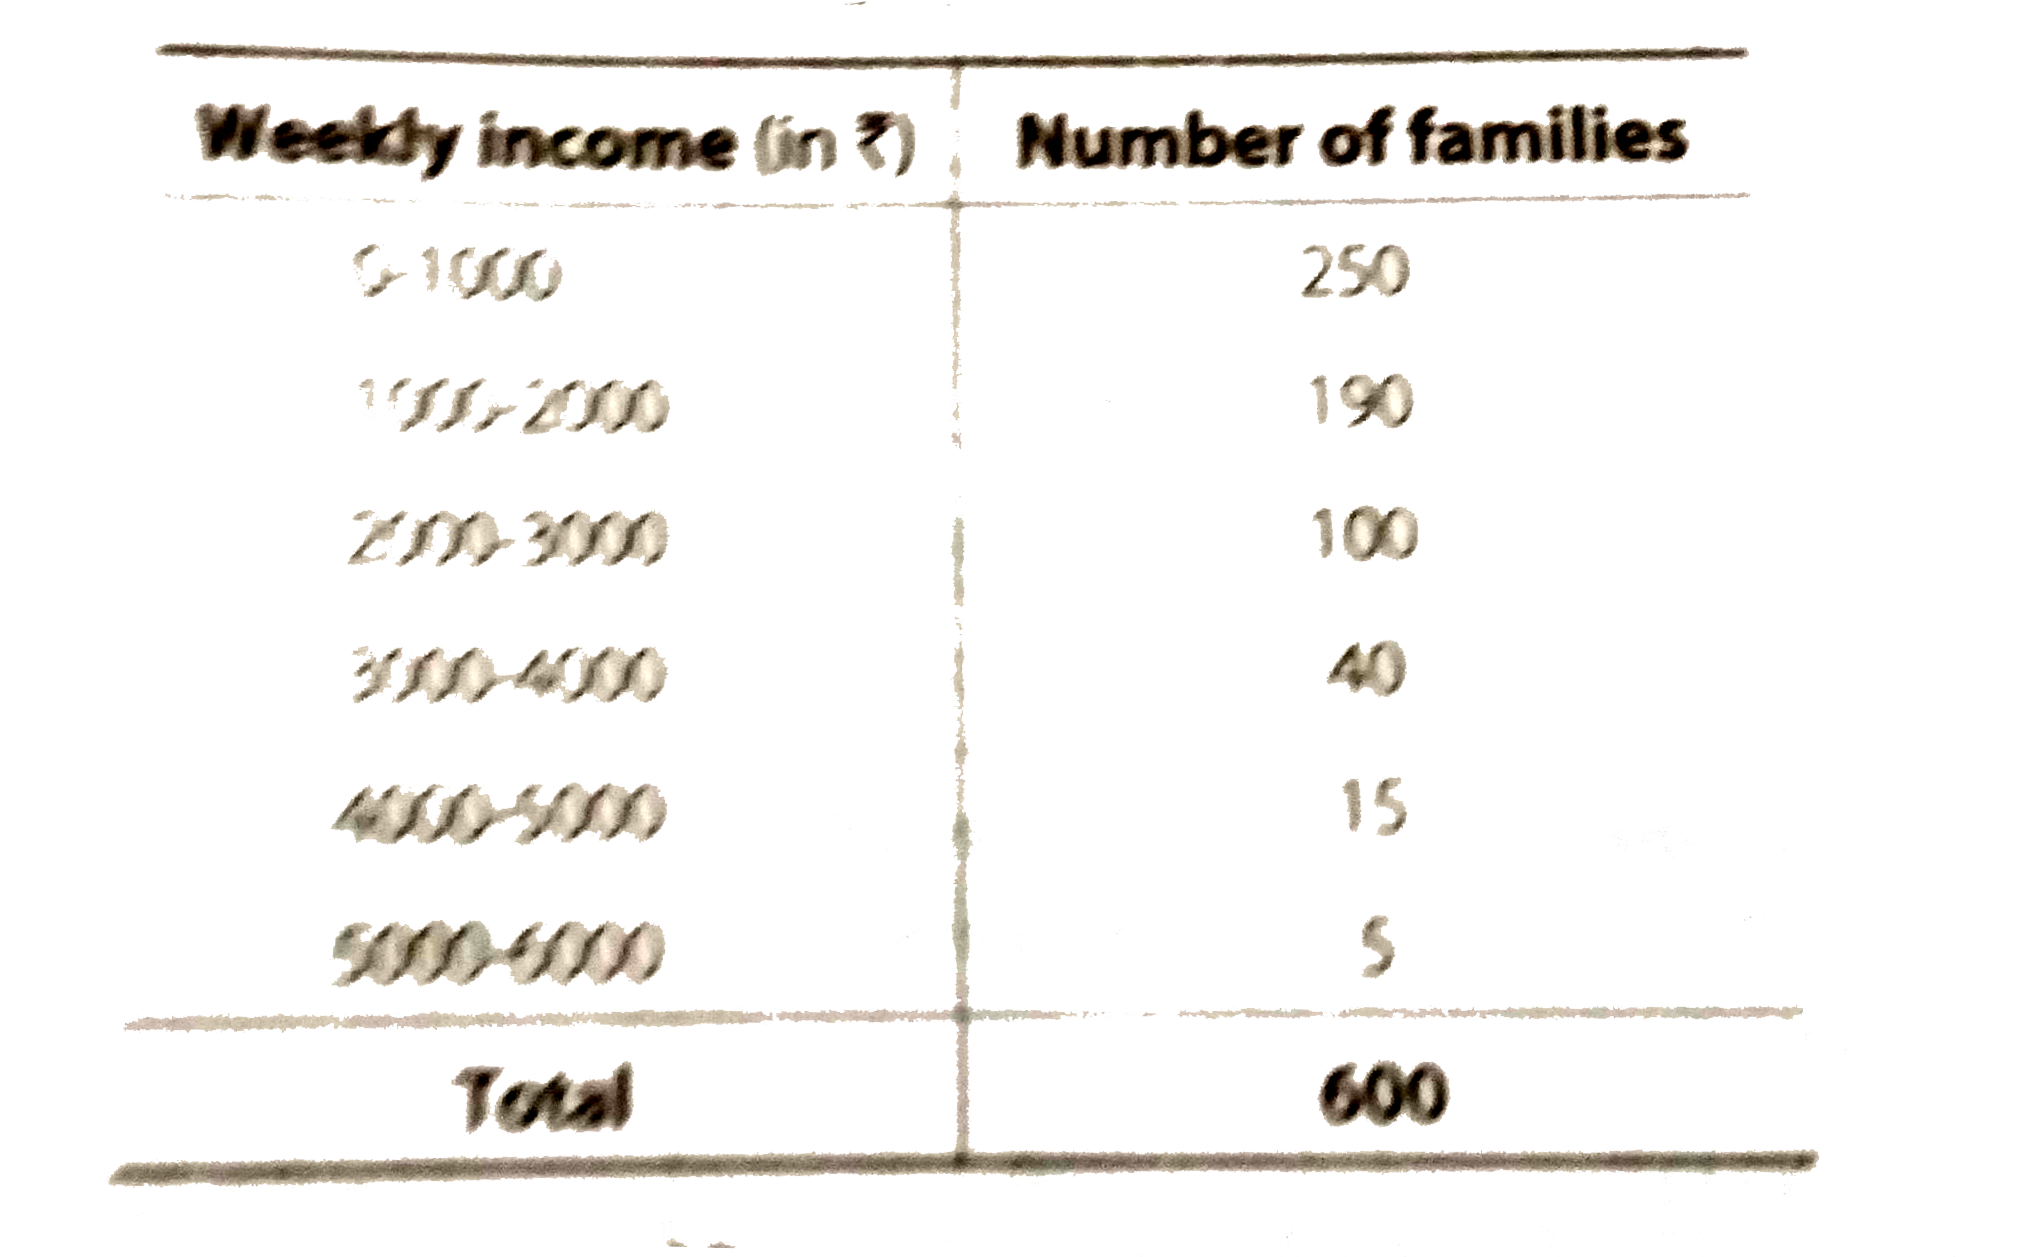
Compute the median income.
First we construct a cumulative frequency table.
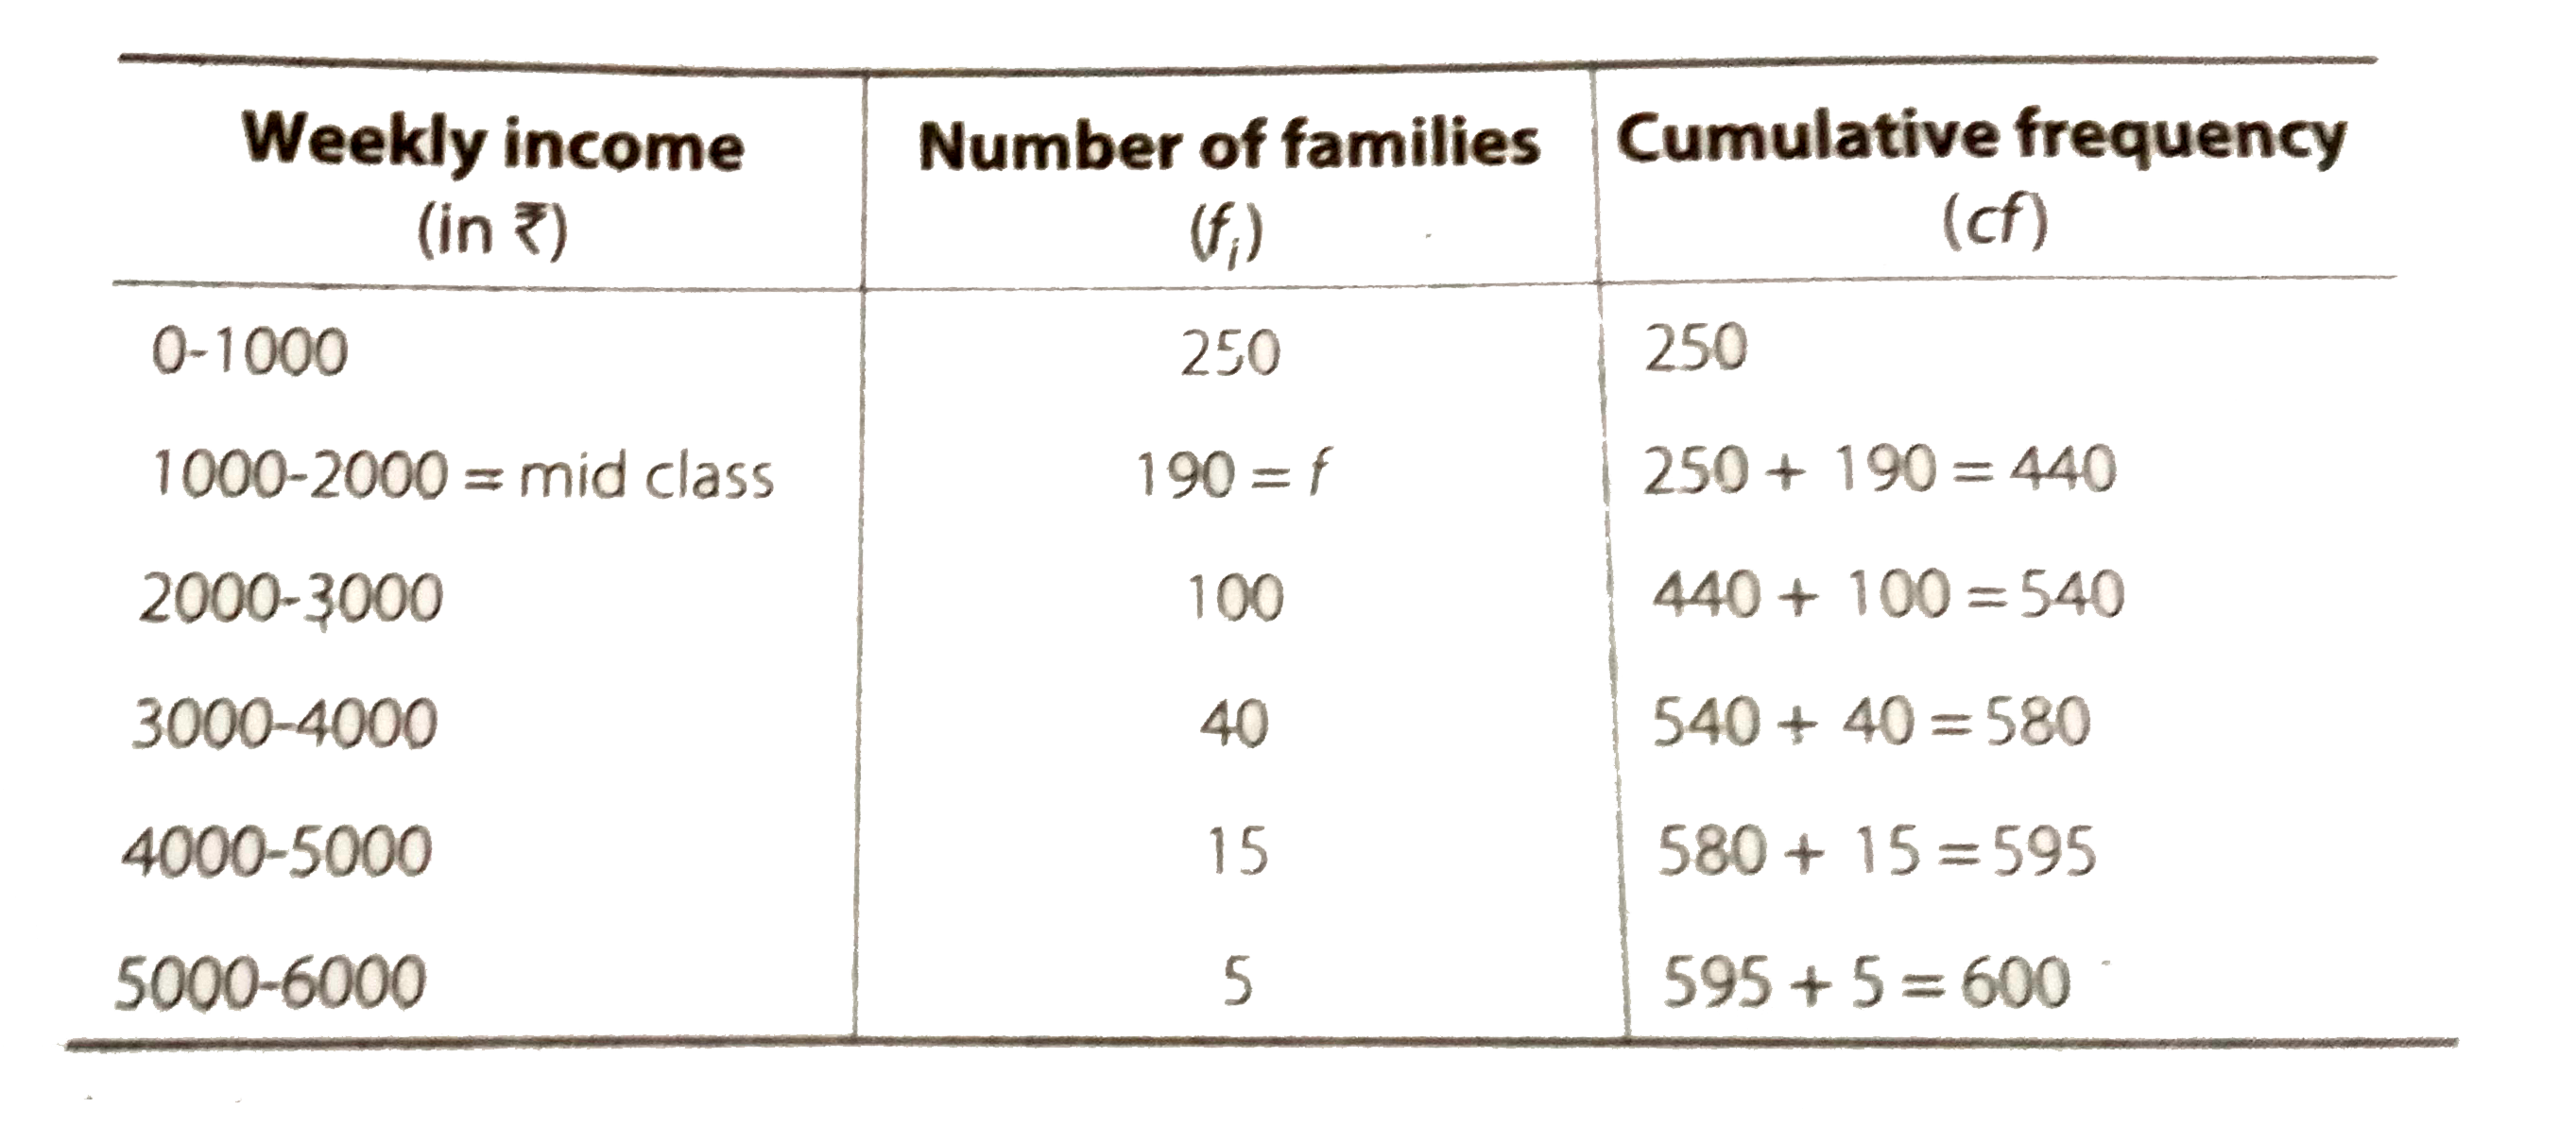
It is given that, n=600
∴n2=6002=300
Since, cumulative frequency 440 lies in the interval 1000-2000.
Here, (lower meidan class) l=1000, f=190, cf=250(class width) j=1000
and total observation n=600
Median=l{n2−cf}f×h
=1000+300−250190×1000
=1000+50190×1000
=1000+500019
=1000+263.15=1263.15
Hence, the median income is 1263.15.
Topper's Solved these Questions
- STATISTICS AND PROBABILITYBOOK - NCERT EXEMPLAR ENGLISHCHAPTER - STATISTICS AND PROBABILITYEXERCISE - LONG ASWERS QUESTIONS
14 Videos
- STATISTICS AND PROBABILITYBOOK - NCERT EXEMPLAR ENGLISHCHAPTER - STATISTICS AND PROBABILITYEXERCISE - VERY SHORT ANSWERS QUESTIONS
14 Videos
- REAL NUMBERSBOOK - NCERT EXEMPLAR ENGLISHCHAPTER - REAL NUMBERSEXERCISE - LONG ANSWER TYPE QUESTIONS
5 Videos
- SURFACE AREAS AND VOLUMESBOOK - NCERT EXEMPLAR ENGLISHCHAPTER - SURFACE AREAS AND VOLUMESEXERCISE - LONG ANSWER TYPE QUESTIONS
20 Videos
Similar Questions
The monthly income of 100 families are given as below
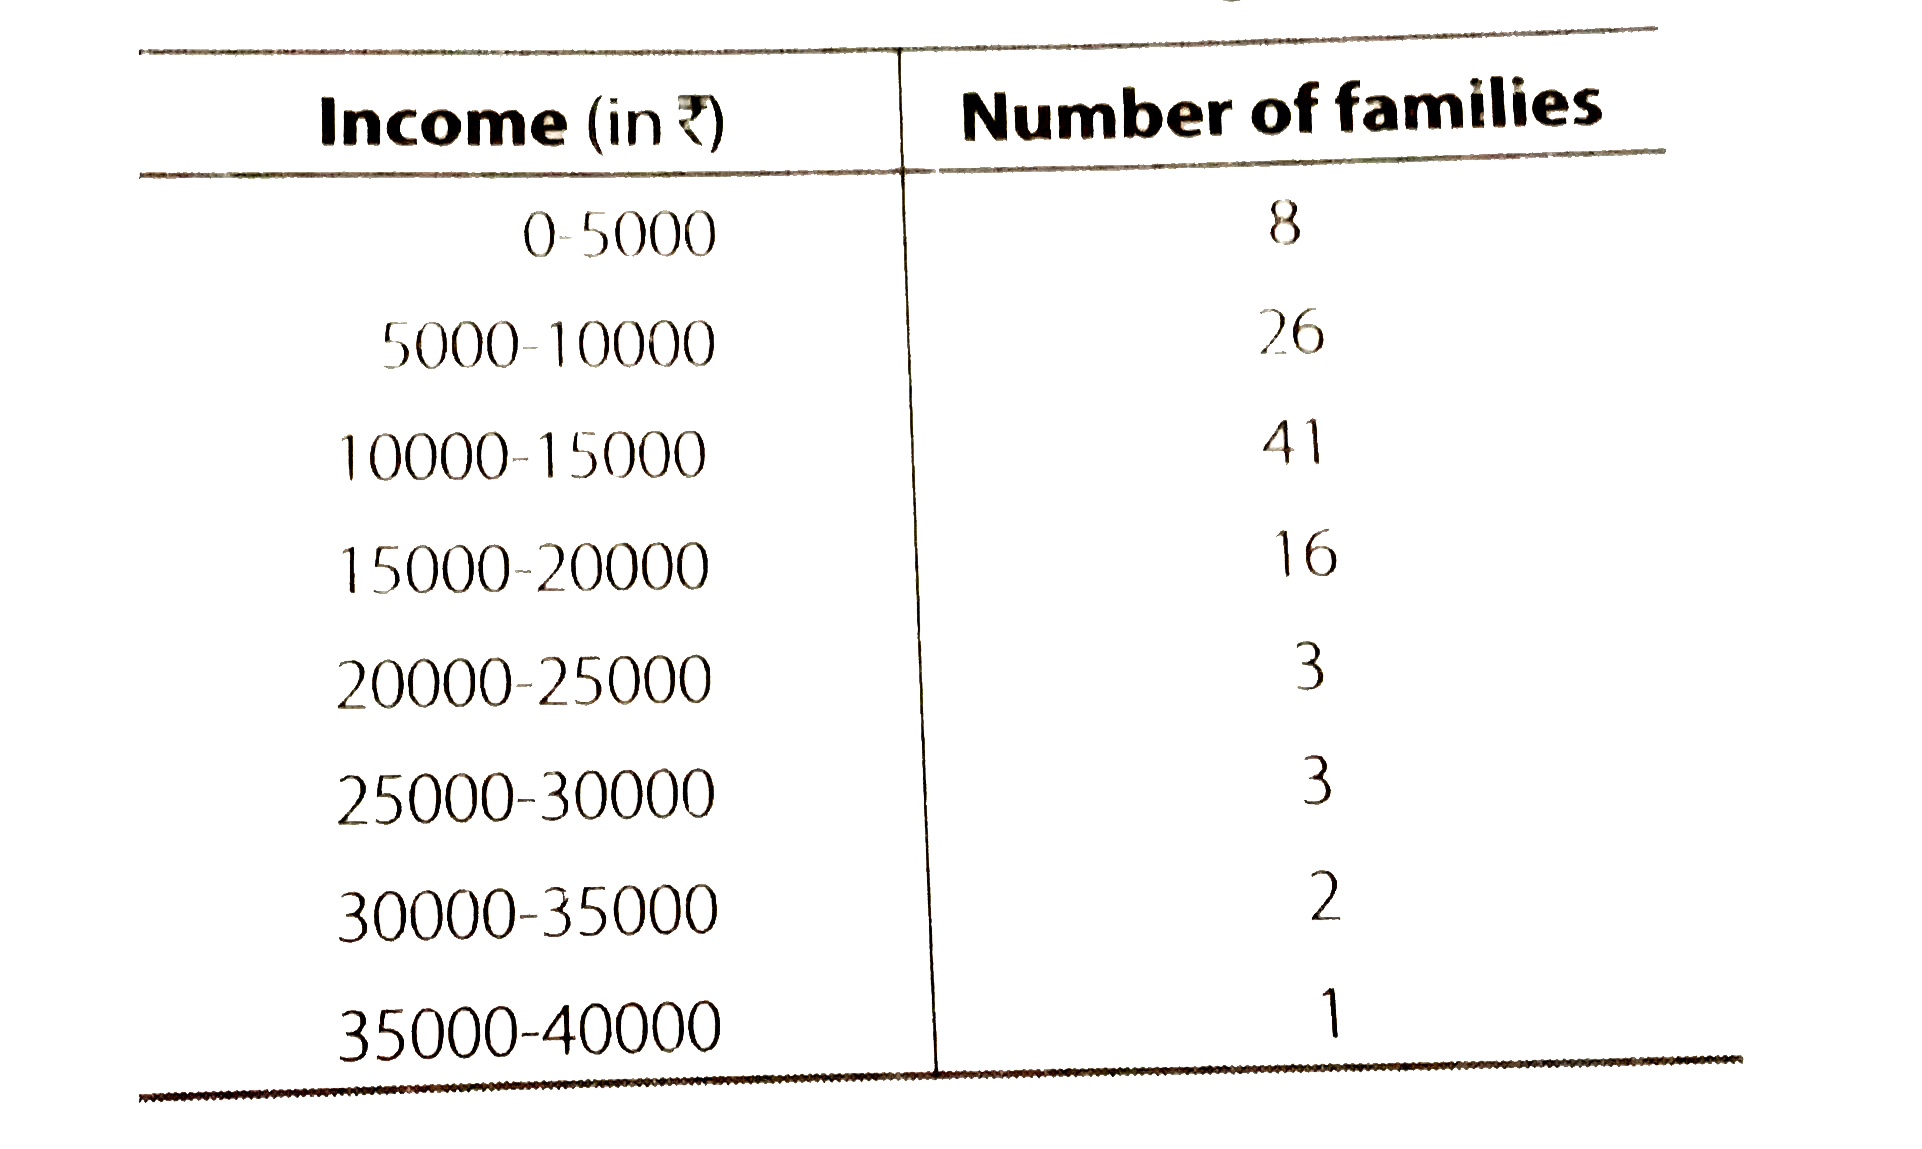
Calculate the modal income.
View SolutionThe following table gives the distribution of income of 100 families in a village. Calculate the standard deviation: Income Rs., 0-1000, 1000-2000, 2000-3000, 3000-4000, 4000-5000, 5000-6000 No. of Families, 18, 26, 30, 12, 10, 4
View SolutionThe following table gives the distribution of income of 100 families in a village. Calculate the standard deviation: Income Rs. 0-1000 1000-2000 2000-3000 3000-4000 4000-5000 5000-6000 No. of Families 18 26 30 12 10 4
View SolutionSize of agricultural holding in a survey of 200 families is given in the following table.
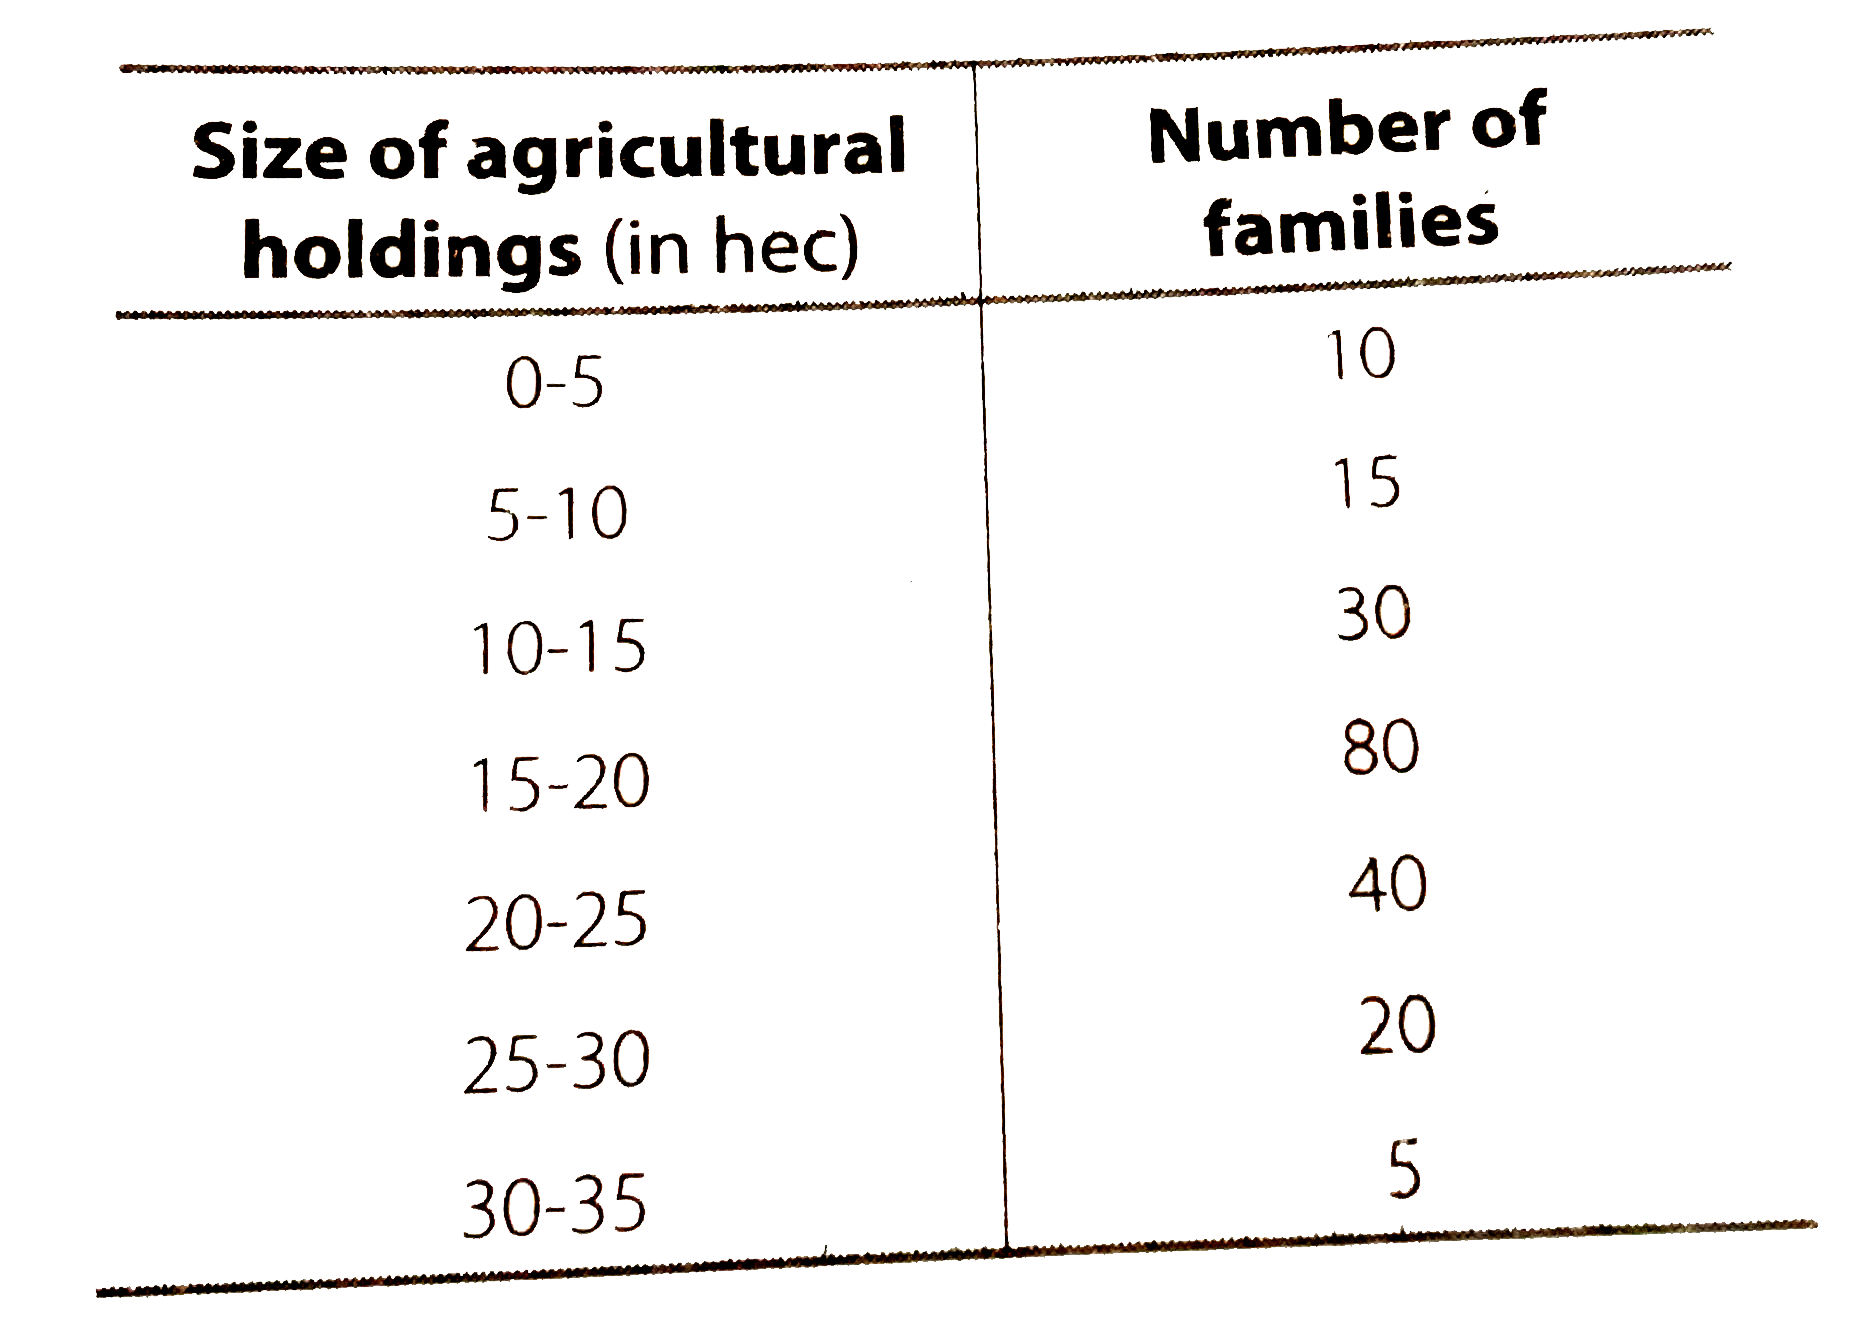
Compute median and mode size of the holdings.
View SolutionThe daily income of a sample of 50 employees are tabulated as follows.

Find the mean daily income of employees.
View SolutionThe following pie-chart shows the monthly expenditure of a family on food, clothing, rent, miscellaneous expenses and savings. If the family spends Rs. 825 on clothing, answer the following questions: (i) What is the total monthly income of the family? (ii) What percent of the total income does the family save?
View SolutionCalculate the mean deviation of the following income groups of five and seven members from their medians: 1st income group (in Rs.): 4000 4200 4400 4600 4800 2nd income group (in Rs.): 3800 4000 4200 4400 4600 4800 5800
View SolutionThe mean and S.D. of the income of the employers of two banks are as follows:

Compare the coefficient of variation of the income of the employees of the two banks.
View SolutionA survey was made on the breed of dogs kept by pets in different families in a city and the results were tabulated as shown below:
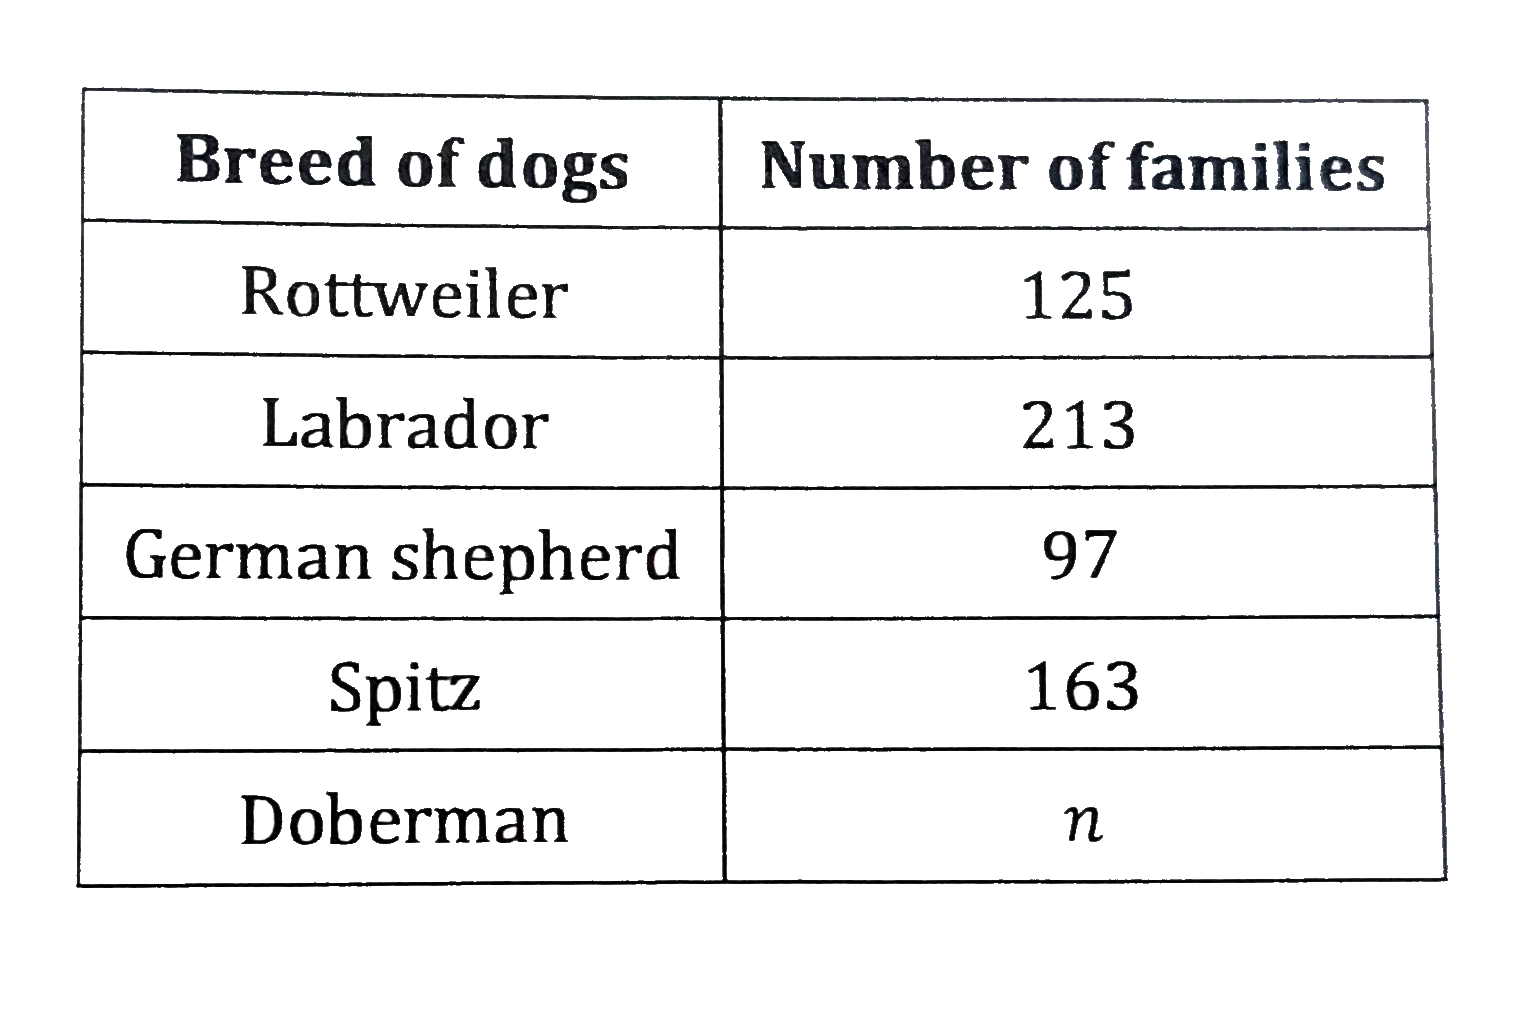
If the median number of dogs was 163, what is the minimum possible value of n ?
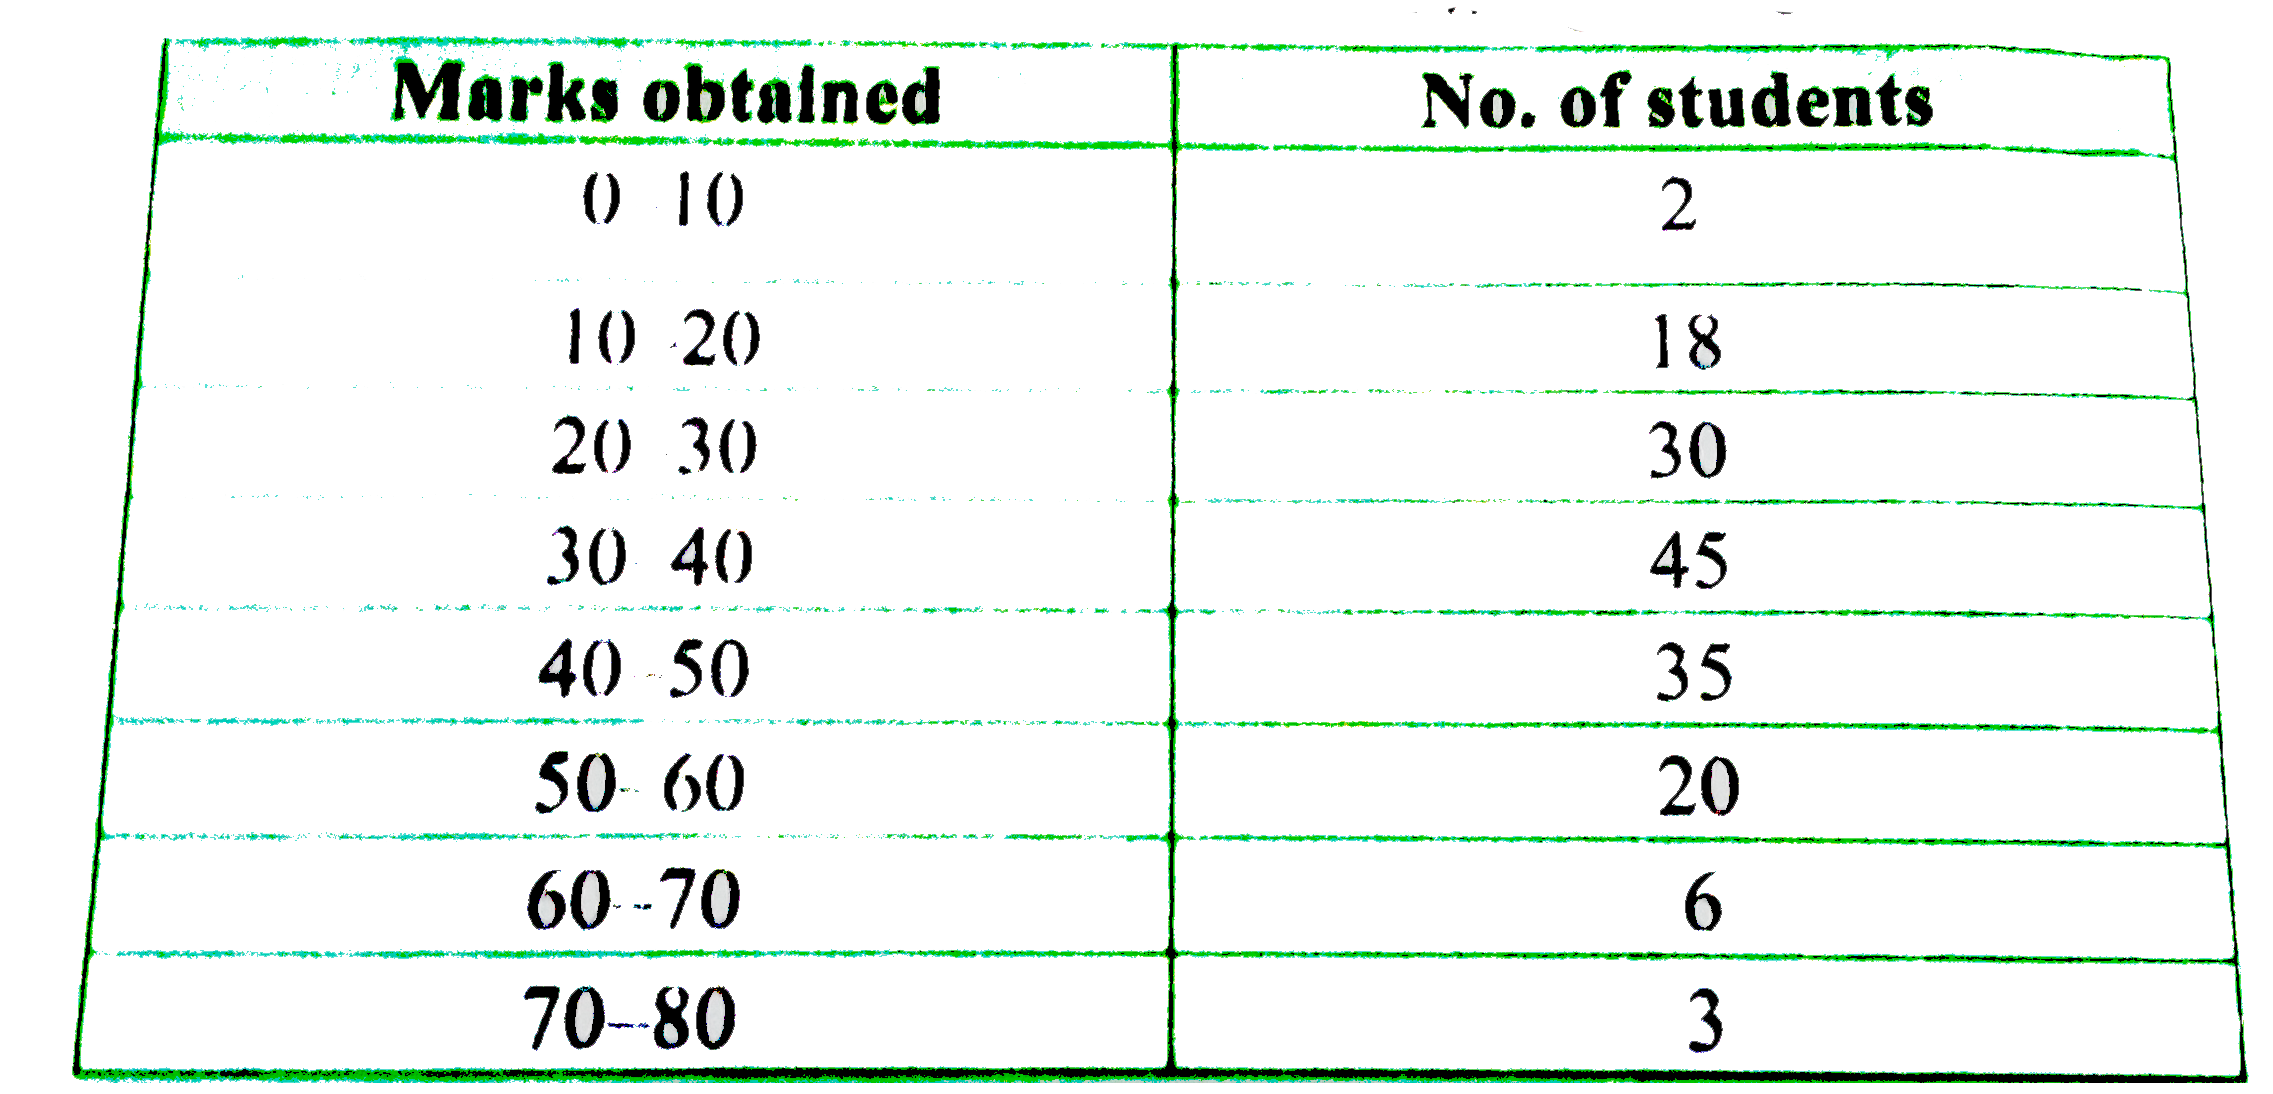
View SolutionCompute the median from the following table
View Solution
