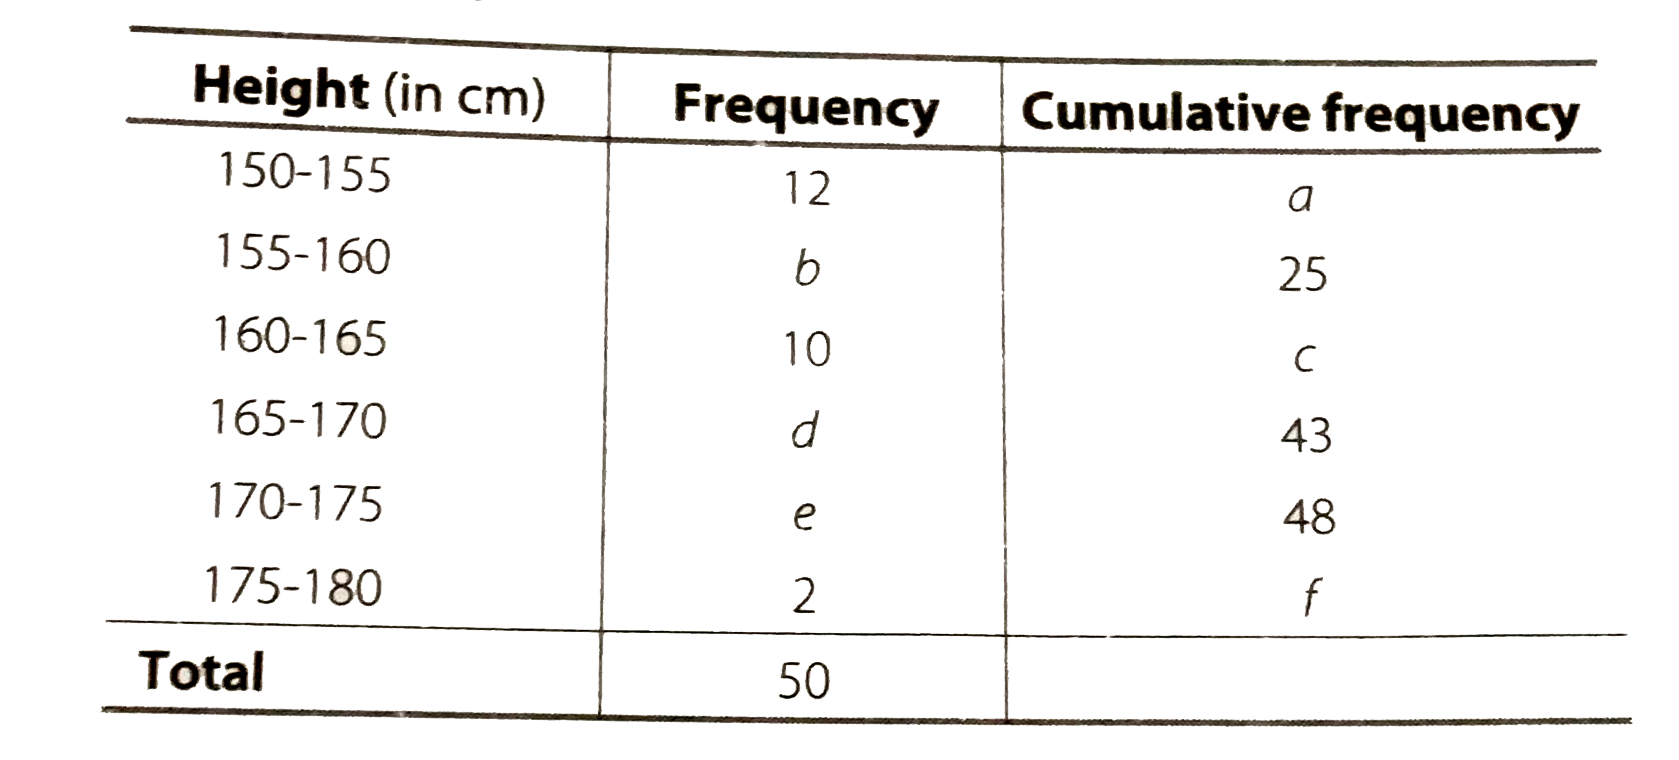
Find the unknown entries a,b,c,d,e and f in the following distribution of heights of students in a class


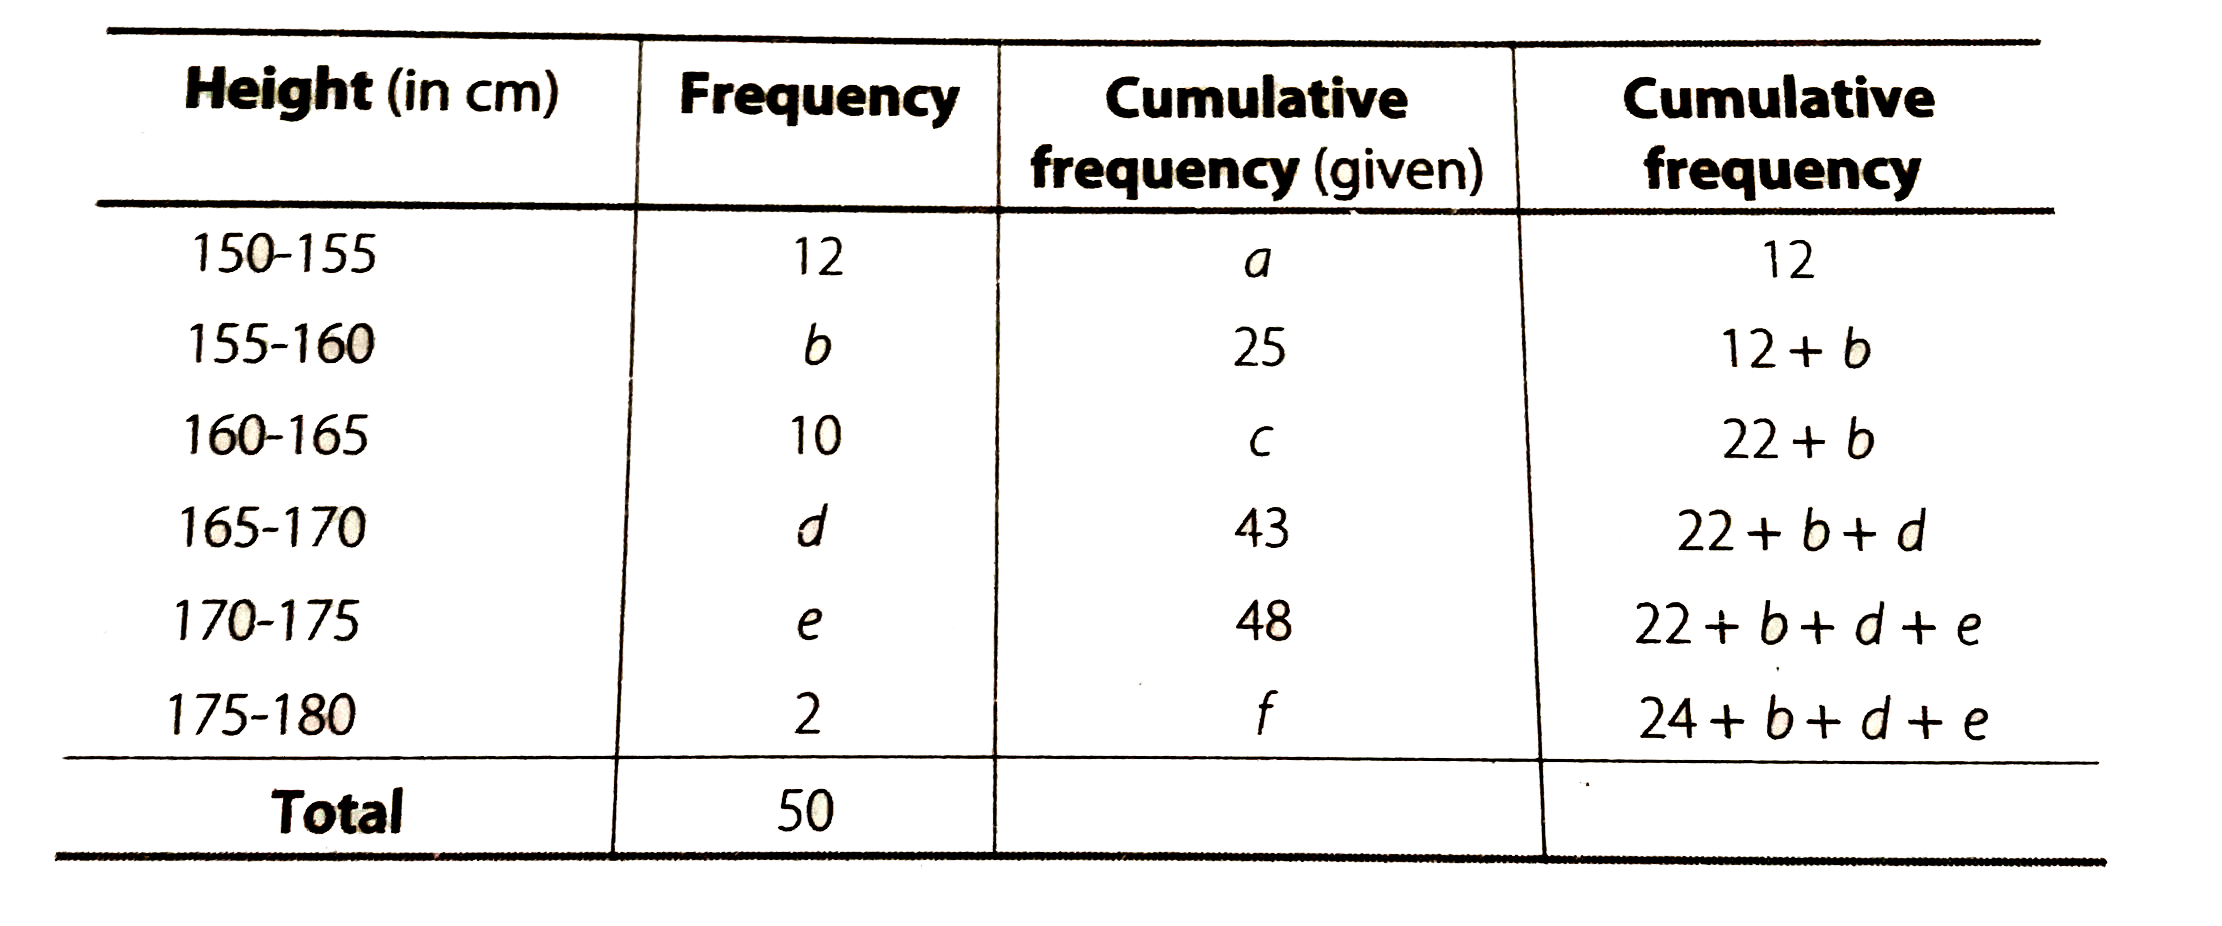
On comparing last two tables, we get
a=12
∴=12+b=25
⇒b=25−12=13
22+b=c
⇒c=22+13=35
22+b+d=43
⇒22+13+d=43
⇒22+13+d=43
⇒d=43−35=8
and 22+b+d+e=48
⇒22+13+8+e=48
⇒e=48−43=5
and 24+b+d+e=f
⇒24+13+8+5=f
∴f=50
Topper's Solved these Questions
- BOOK - NCERT EXEMPLAR ENGLISHCHAPTER - STATISTICS AND PROBABILITYEXERCISE - LONG ASWERS QUESTIONS14videos
STATISTICS AND PROBABILITY
- BOOK - NCERT EXEMPLAR ENGLISHCHAPTER - STATISTICS AND PROBABILITYEXERCISE - VERY SHORT ANSWERS QUESTIONS14videos
STATISTICS AND PROBABILITY
- BOOK - NCERT EXEMPLAR ENGLISHCHAPTER - REAL NUMBERSEXERCISE - LONG ANSWER TYPE QUESTIONS5videos
REAL NUMBERS
- BOOK - NCERT EXEMPLAR ENGLISHCHAPTER - SURFACE AREAS AND VOLUMESEXERCISE - LONG ANSWER TYPE QUESTIONS20videos
SURFACE AREAS AND VOLUMES
Similar Questions
Find the unknown entries (a,b,c,d,e,f,g) from the following frequency distribution of heights of 50 students in a class: Class intervals (heights in cm) Frequency Cumulative Frequency 150-155 155-160 160-165 165-170 170-175 175-180 12 b 10 d e 2 a 25 c 43 48 f
View SolutionIdentify a, b, c,d,e and f in the following table :
 View Solution
Identify a, b, c,d,e and f in the following table :
 View Solution
Find the mean of the students for the following distribution
 View Solution
The mean of the following distribution is 18. Find the frequency f of the class 19−21.
View SolutionFind the mean of the frequency distribution:

(ii) The weight of 40 students of class IX are given below:
 View Solution
The mean of the following distribution is 52 and the frequency of class interval 30-40 is f. Find f.
View SolutionThe following distributions represent the height of 160 studens of a class :

Find the modal heightView SolutionThe following table shows the distribution of the heights of a group of students:

Use a graph sheet to draw an Ogive for the distribution. Use the Ogive to find:
the number of students whose height is more than 168 cmView SolutionThe following table shows the distribution of the heights of a group of students:

Use a graph sheet to draw an Ogive for the distribution. Use the Ogive to find:
the number of students whose height is less than 148 cm.View Solution

