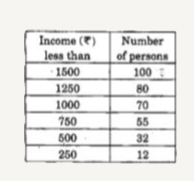
The following table shows the ages of 100 persons of a locality.

Represent the above as the less than type frequency distribution and
draw an ogive for the same.
N=100, then N/2=100/2=50
On y−axis draw horizontal line from 50. The point at which line touches the curve draw a vertical line from there towards x−axis.
The point at which line touches the x−axis is the median of the data.
∴ Median =34.34
Topper's Solved these Questions
Similar Questions
Draw a less than ogive for the following frequency distribution.
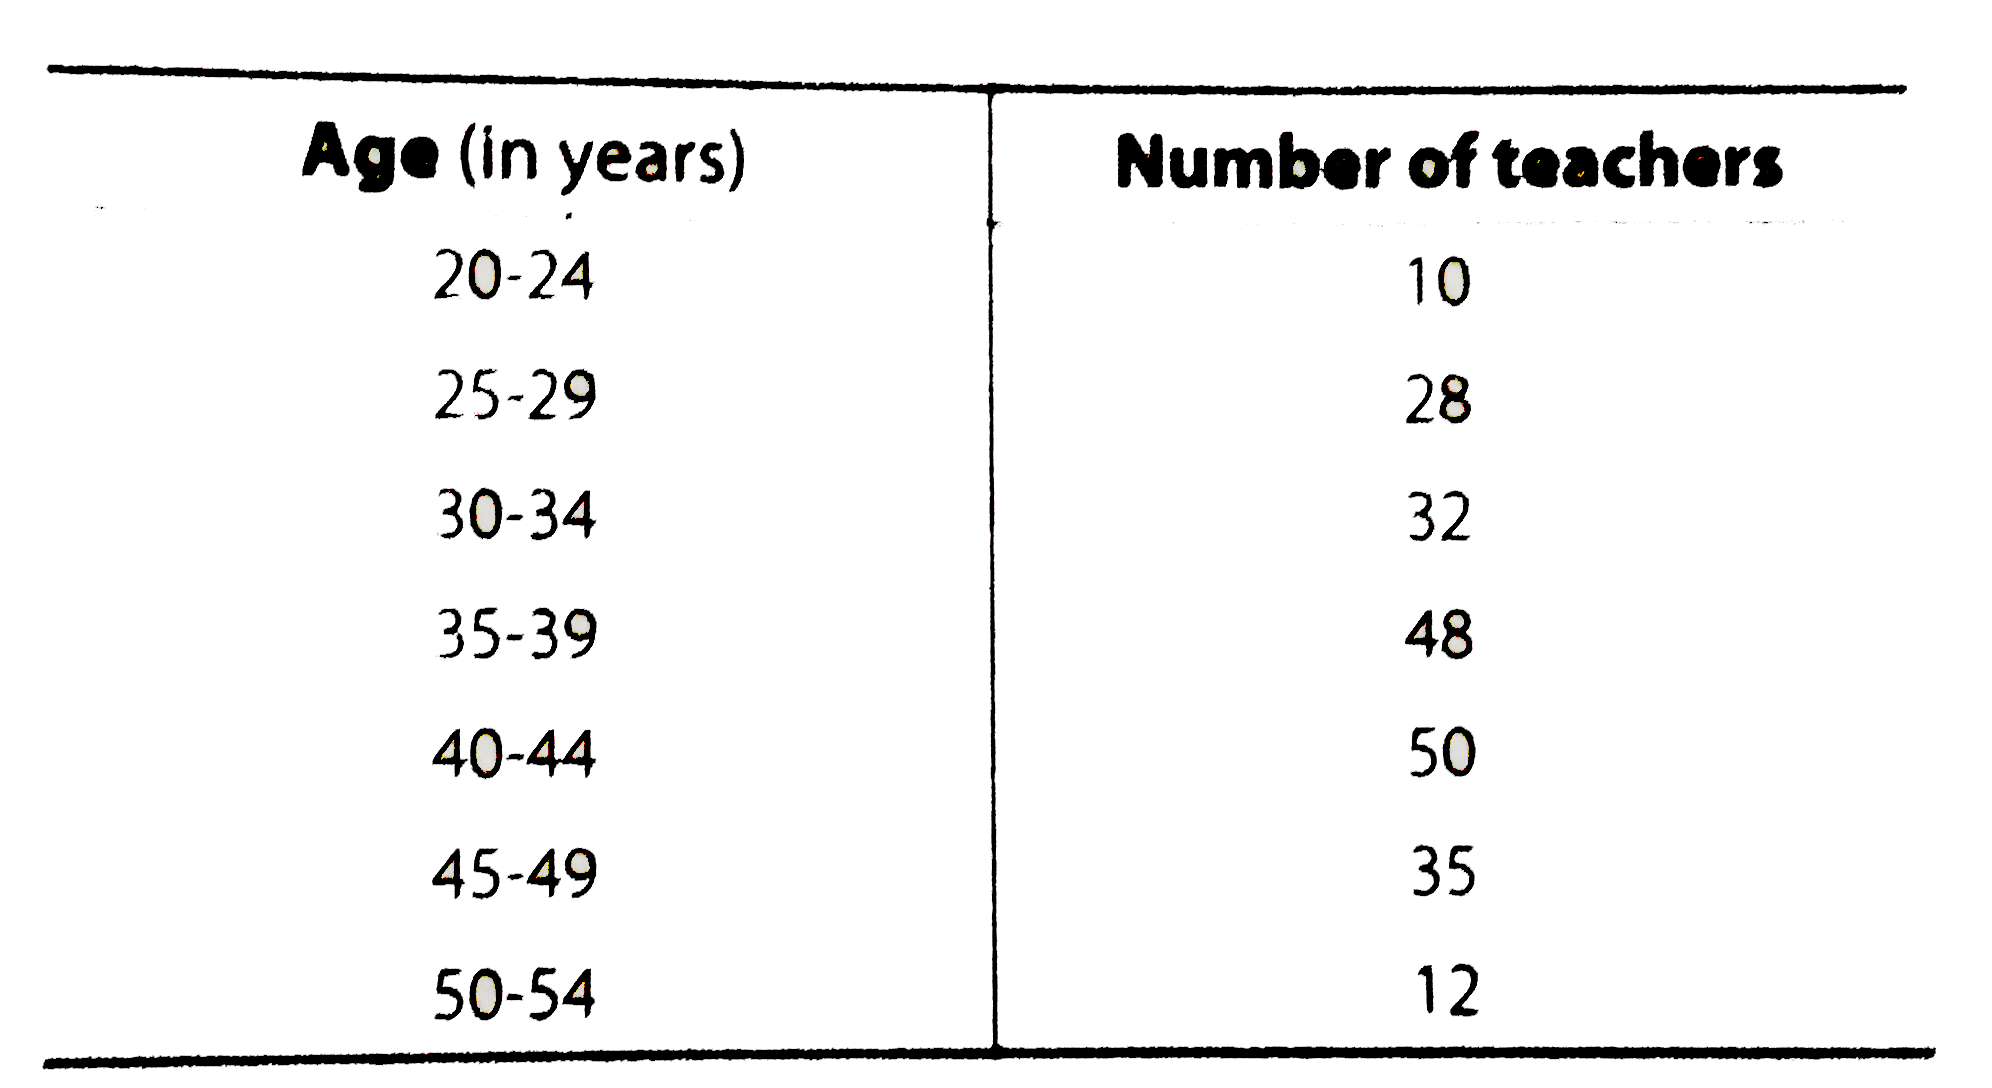
View SolutionThe following table gives the height of 42 trees in meters:

Change the above distribution to less than type distribution and draw its ogive. Hence obtain the median value.View SolutionWrite the following data into less than cummulative frequency distribution table.
 View Solution
Draw a 'less than' ogive for the following frequency distribution:
View SolutionThe following distribution gives the daily income of 50 workers of a factory: Convert the distribution above to a less than type cumulative frequency distribution and draw its ogive
View SolutionThe following distribution gives the daily income of 50 workers of a factory.

Convert the distribution above to a less than type cumulative frequency distribution, and draw its ogive.View SolutionThe following distribution gives the daily income of 60 workers of a factory. Convert the distribution above to a less than type cumulative frequency distribution, and draw its ogive.
View SolutionThe following table gives less than' type frequency distribution of income per day:

What is the modal class ?View SolutionDraw a histogram to represent the following grouped frequency distribution.
 View Solution
Draw a histogrum and to represent the following frequency distribution :
View Solution

