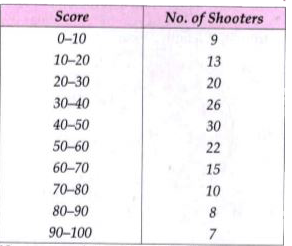
The frequency distribution of scores obtained by 230 candidates in a medical entrance test is as follos :

Draw a less than cumulative curve (ogive to represent the data.
Step by step video & image solution for The frequency distribution of scores obtained by 230 candidates in a medical entrance test is as follos : Draw a less than cumulative curve (ogive to represent the data. by Maths experts to help you in doubts & scoring excellent marks in Class 10 exams.
Updated on:21/07/2023Topper's Solved these Questions
- STATISTICS BOOK - NAGEEN PRAKASHAN ENGLISHCHAPTER - STATISTICS EXERCISE - Revision Exercise Very Short Answer Questions
9 Videos
- STATISTICS BOOK - NAGEEN PRAKASHAN ENGLISHCHAPTER - STATISTICS EXERCISE - Revision Exercise Short Answer Questions
5 Videos
- STATISTICS BOOK - NAGEEN PRAKASHAN ENGLISHCHAPTER - STATISTICS EXERCISE - Exercise 14 D
5 Videos
- SOME APPLICATIONS OF TRIGONOMETRYBOOK - NAGEEN PRAKASHAN ENGLISHCHAPTER - SOME APPLICATIONS OF TRIGONOMETRYEXERCISE - Long Answer Questions
5 Videos
- TRIANGLES BOOK - NAGEEN PRAKASHAN ENGLISHCHAPTER - TRIANGLES EXERCISE - Revision Exercise Long Questions
1 Videos
Similar Questions
Draw a less than cumuative frequency curve (ogive) for the following distribution :

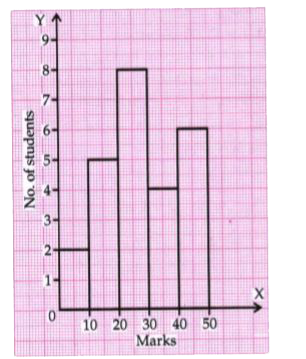
View SolutionThe historgam below represents the scores obtained by 25 students in a Mathematics mental test. Use the data to :
(ii) to calculate mean.

View SolutionDraw a less than cumulative curve (ogive to represent the data.

Also, find the mdian with the help of less than ogive.
View SolutionDraw a 'less than' give for the following frequency distribution :

View SolutionThe table shows the distribution of the scores obtained by 160 shooters in a shooting competition. Use a graph sheet and draw an ogive for the distribution. (Take 2 cm = 10 scores on the X-axis and 2 cm = 20 shooters on the Y-axis)

Use your graph to estimate the following :
(i) The median.
(ii) The interquartile range.
(iii) The number of shooters who obtained a score of more than 85%.
View SolutionFor the following data, draw a 'less than' ogive and hence find the median of the distribution.

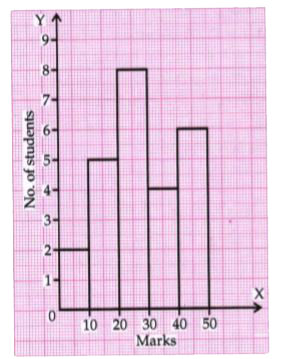
View SolutionThe historgam below represents the scores obtained by 25 students in a Mathematics mental test. Use the data to :
(i) Frame a frequency distribution table.

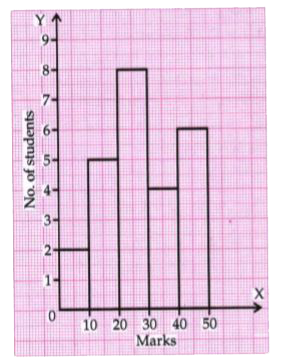
View SolutionThe historgam below represents the scores obtained by 25 students in a Mathematics mental test. Use the data to :
(iii) To determine the Modal class.

View SolutionA student draws a cumulative frequency curve for the marks obtained by 40 students of a class as shown below. Find the median marks obtained by the students of the class. (FIGURE)
View SolutionDuring the medical check-up of 35 students of a class, their weights were recorded as follows: Draw a less than type ogive for the given data. Hence obtain the median weight from the graph and verify the result by using the formula. weight (in kg)=38-40 40-42 42-44 44-46 46-48 48-50 50-52 No. of students=3 2 4 5 14 4 3
View Solution
