The given double column graph compares the average number of hours for which an electrical appliance is used on weekdays and weekends .Study the graph carefully and answer the questions that follows .
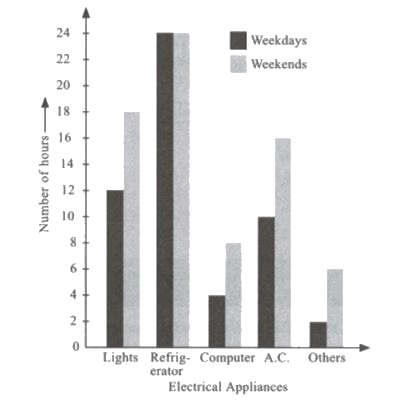
What is the total number of appliances used in weekdays ?
82
72
52
None of these
The correct Answer is:C
Step by step video, text & image solution for The given double column graph compares the average number of hours for which an electrical appliance is used on weekdays and weekends .Study the graph carefully and answer the questions that follows . What is the total number of appliances used in weekdays ? by Maths experts to help you in doubts & scoring excellent marks in Class 8 exams.
Updated on:21/07/2023Topper's Solved these Questions
- IMO QUESTION PAPER 2017-18 SET-BBOOK - SCIENCE OLYMPIAD FOUNDATION CHAPTER - IMO QUESTION PAPER 2017-18 SET-BEXERCISE - ACHIEVERS SECTION
5 Videos
- IMO QUESTION PAPER 2017-18 SET ABOOK - SCIENCE OLYMPIAD FOUNDATION CHAPTER - IMO QUESTION PAPER 2017-18 SET AEXERCISE - ACHIEVERS SECTION
5 Videos
- IMO QUESTION PAPER 2018-19 SET -B BOOK - SCIENCE OLYMPIAD FOUNDATION CHAPTER - IMO QUESTION PAPER 2018-19 SET -B EXERCISE - ACHIEVERS SECTION
5 Videos
Similar Questions
Knowledge Check
Study the following graph carefully and answer the questions that follow
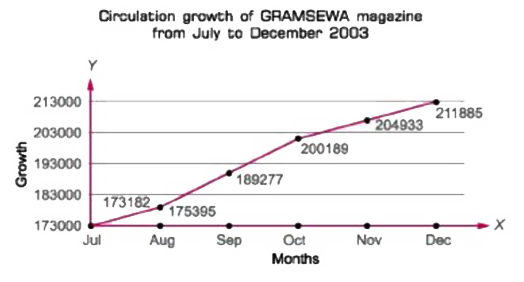
What is the total circulation of magazine from July to December ?A1154681B1154861C1145861D1150862Study the following graph carefully to answer the questions that follow-----
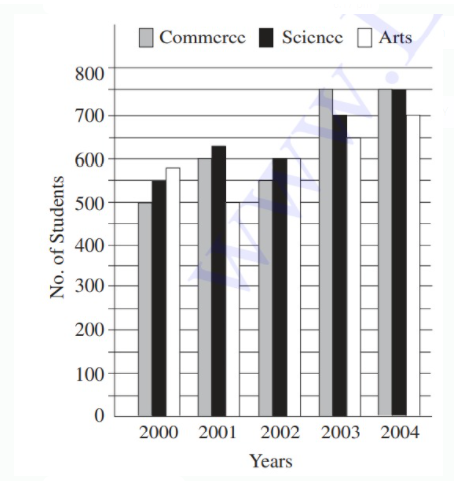
What is the total number of students studying Arts in all the years together ?A3700B2750C3500DNone of theseStudy the following graph carefully and answer the questions that follow
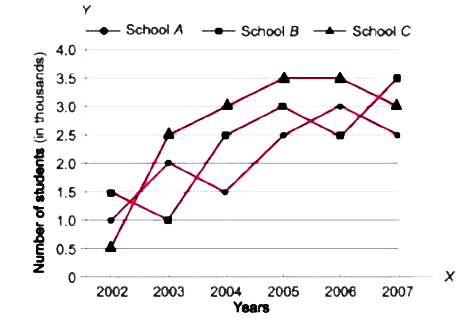
What was the average number of students in all schools together in the year 2006 ?A30000B9000C3000D6000
Study the given graph carefully and answer the following questions.
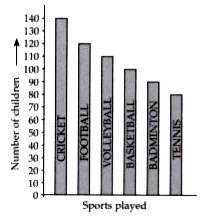
What fraction of the total number of children plays football ?
View SolutionRead the following graph carefully and answer the questions given below:
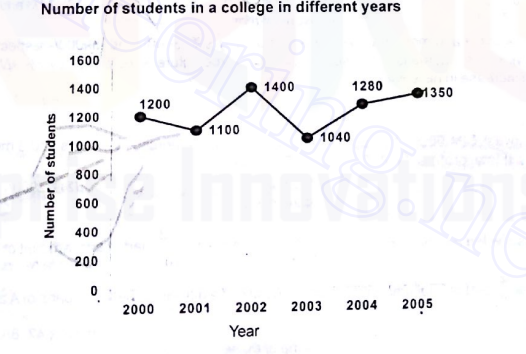
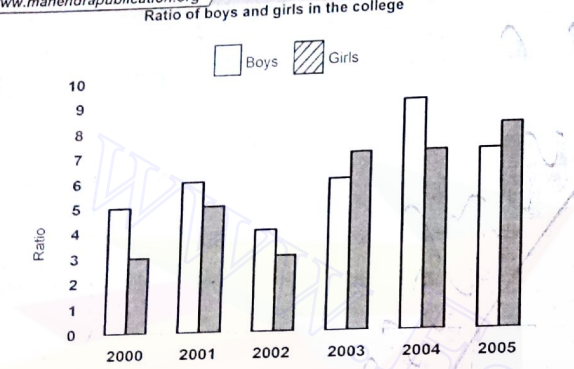
In which two years the number of girls is equal ?
View SolutionStudy the following graph carefully and answer the questions that
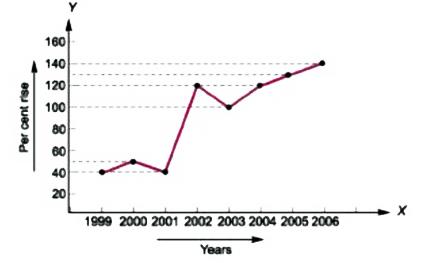
What was the average of percent rise over the given years ?
View SolutionStudy the following graph carefully and answer the questions that follow
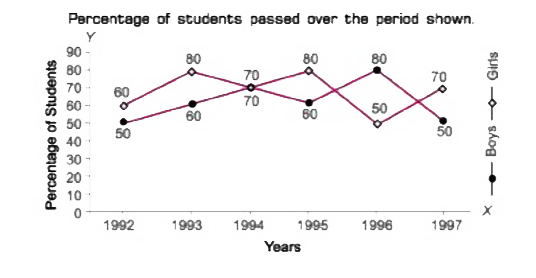
What is the ratio of the average of failed girls and that of failed boys ?
View SolutionStudy the graph carefully and answer the following questions.
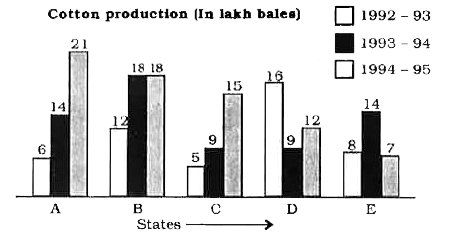
Which of the following statement is false ?
View Solution

