Study the graph carefully and answer the following questions.
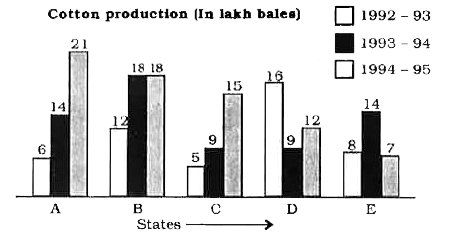
Which of the following statement is false ?
State A and E showed the same production in 1993-94.
There was no improvement in the production of cotton in state B during 1994-95.
State A has produced maximum cotton during the given period.
Production of state C and D together is equal to that of state B dring 1993-94.
The correct Answer is:D
Step by step video, text & image solution for Study the graph carefully and answer the following questions. Which of the following statement is false ? by Maths experts to help you in doubts & scoring excellent marks in Class 14 exams.
Topper's Solved these Questions
- BOOK - KIRAN PUBLICATIONCHAPTER - STATISTICS AND DATA INTERPRETATIONEXERCISE - TYPE-V38videos
STATISTICS AND DATA INTERPRETATION
- BOOK - KIRAN PUBLICATIONCHAPTER - STATISTICS AND DATA INTERPRETATIONEXERCISE - TYPE-VI86videos
STATISTICS AND DATA INTERPRETATION
- BOOK - KIRAN PUBLICATIONCHAPTER - STATISTICS AND DATA INTERPRETATIONEXERCISE - TYPE-III39videos
STATISTICS AND DATA INTERPRETATION
- BOOK - KIRAN PUBLICATIONCHAPTER - SIMPLIFICATIONEXERCISE - TEST YOURSELF25videos
SIMPLIFICATION
- BOOK - KIRAN PUBLICATIONCHAPTER - TIME AND DISTANCEEXERCISE - Type -XI74videos
TIME AND DISTANCE
Similar Questions
Knowledge Check
- Question 1 - Select One
Study the following graph carefully and answer the questions that follow
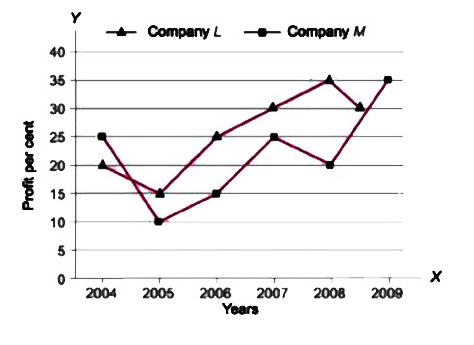
Which of the following statements is true with respect to the above graph ?ACompany M made the highest profit in the year 2009BCompany L made the least profit in the year 2005CThe ratio of the profits earned by company L and company M in the year 2006 was 6:5DCompany L made the highest profit in the year 2008 - Question 2 - Select One
Examine the following graph carefully and answer the questions given below it :
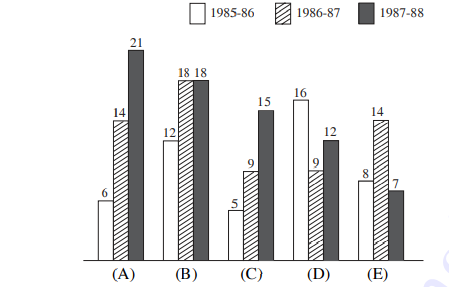
Which of the following statements is false ?AStates A and E showed the same production in 1986-87BThere was no improvement in the production of cotton in state B during 1987-88CState A has produced maximum cotton during the given periodDProducts of states C and D together is equal to that of state B during 1986-87 - Question 3 - Select One
A graph between vapour pressure and temperature of few liquids is given below. Study the graph and answer following question.
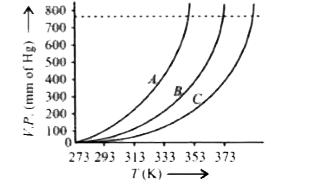
Which of the following statements is not true?ABoiling point of a liquid is the temperature at which its vapour pressure becomes equal to atmospheric pressure.BBoiling point of water can be increased by increased the pressure above the atmospheric pressureCIf liquid B is heated in a closed vessel it will boil at 353 KDLiquid C has higher boilingk point than B due to higher intermolecular forces.
Study the bar graph and answer the following questions.
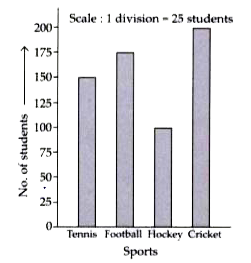
Which is the most popular sport ?View SolutionStudy the graph carefully and answer the following questions.
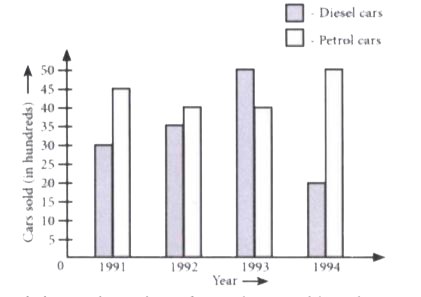
Find the mean sale of Petrol cars.View SolutionStudy the following graph carefully and answer the questions that follow
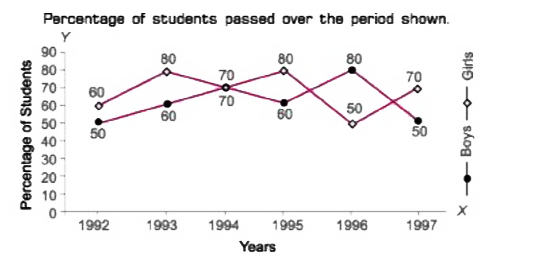
In which of the following years was the improvement of girls maximum as compared to that of previous years ?View Solution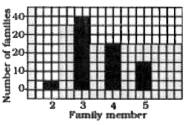
Study the bar graph carefully and answer the following question.
Which type if family is the most common ?View SolutionStudy the following graph carefully and answer the questions given below
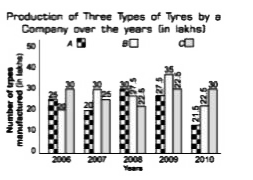
In which of the following years, was the percentage production of B type to C type the maximum?View Solution


