The given line graph shows the number of toys sold by a toy company in the first 8 weeks of a particular year.
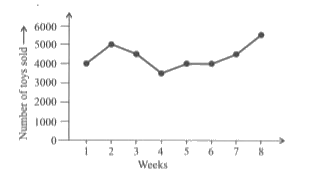
What is the range of the given data?
2000
1000
1500
2500
The correct Answer is:A
Step by step video, text & image solution for The given line graph shows the number of toys sold by a toy company in the first 8 weeks of a particular year. What is the range of the given data? by Maths experts to help you in doubts & scoring excellent marks in Class 7 exams.
Updated on:21/07/2023Topper's Solved these Questions
- IMO MODEL TEST PAPER 2 BOOK - SCIENCE OLYMPIAD FOUNDATION CHAPTER - IMO MODEL TEST PAPER 2 EXERCISE - Everyday Mathematics
10 Videos
- IMO MODEL TEST PAPER 2 BOOK - SCIENCE OLYMPIAD FOUNDATION CHAPTER - IMO MODEL TEST PAPER 2 EXERCISE - Achievers Section
5 Videos
- IMO MODEL TEST PAPER - 1BOOK - SCIENCE OLYMPIAD FOUNDATION CHAPTER - IMO MODEL TEST PAPER - 1EXERCISE - Achievers Section
5 Videos
- IMO QOESTION PAPER 2017-18 SET-BBOOK - SCIENCE OLYMPIAD FOUNDATION CHAPTER - IMO QOESTION PAPER 2017-18 SET-BEXERCISE - EVERYDAY MATHEMATICS
10 Videos
Similar Questions
The given bar graph shows the number of cars sold from Jan to Dec.
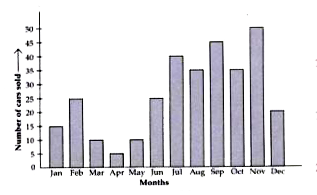
How many cars were sold in the last quarter of the year?
View SolutionThe following data shows the number of students born in different months of a particular year of class VI. Make the bar graph based on the given information.

View Solution
Knowledge Check
The Bar graph given below presents the number of books sold by a bookseller during different months of a year.
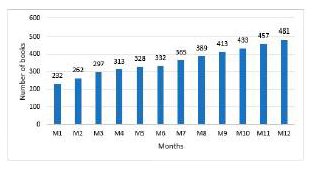
What is the total number of books sold by the bookseller in the year?A4032B4132C4302D4202The bar chart given below shows the number of cars sold by brand A and B for the year for 2008 to 2016
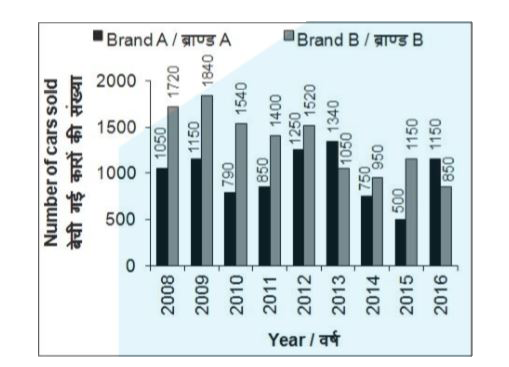
What is the percentage decrease in the number of car sold in year 2015 from year 2014 for brand A?A50B20C25D33.33
The bar graph shows the number of toys produced by a factory during a certain week.
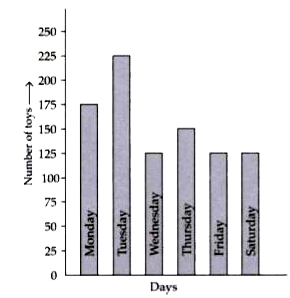
What is the total number of toys produced during the week ?
View SolutionThe pictograph shows the number of computers sold by a company during a week.
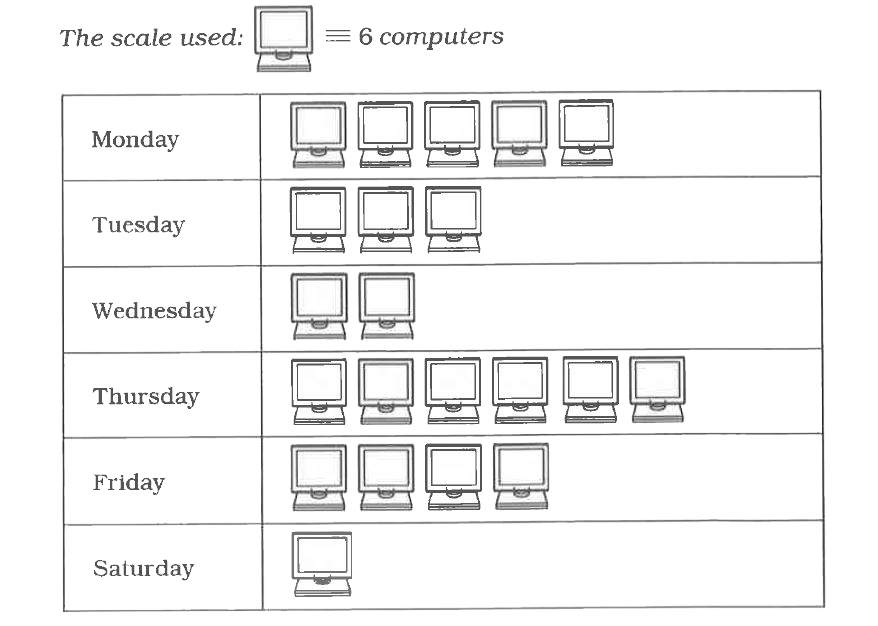
Look at the ptctograph and answer the question given bwlow.
How many computers were sold on Friday ?
How many computers were sold on Monday ?
How many computers were sold during the week ?
On which day was the sale maximum ?
View SolutionThe data given below shows the number motorcycles of the same brand sold by two dealers in the first six months of a year
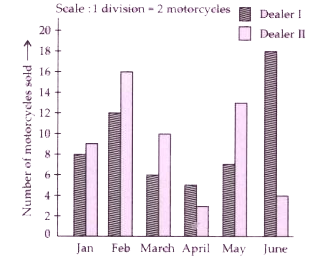
Find the total number of motorcycles sold by dealer II
View SolutionDirection: Read the Graph carefully and answer the following quesitons: The following Line graph shows the number of Fruits (Apple and Banana) sold in five different years.
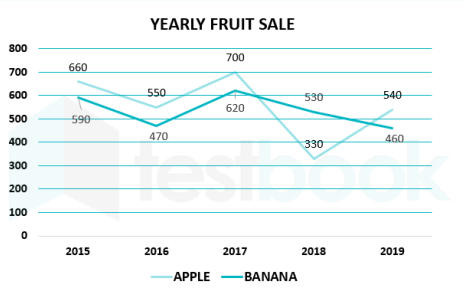
What is the overall average sale of banana?
View SolutionDirection: Read the Graph carefully and answer the following quesitons: The following Line graph shows the number of Fruits (Apple and Banana) sold in five different years.
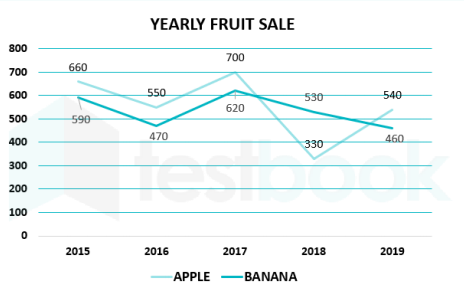
What is the ratio between the sales of apple in 2016 to banana in 2018?
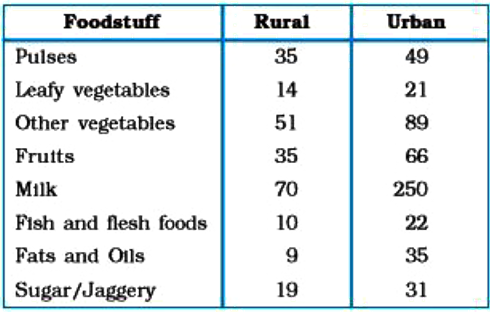
View SolutionThe following table shows the average intake of nutrients in calories by rural and urban groups in a particular year. Using a suitable scale for the given data, draw a double bar graph to compare the data.
View Solution
