The following data shows the number of students born in different months of a particular year of class VI. Make the bar graph based on the given information.

Step by step video & image solution for The following data shows the number of students born in different months of a particular year of class VI. Make the bar graph based on the given information. by Maths experts to help you in doubts & scoring excellent marks in Class 6 exams.
Updated on:21/07/2023Topper's Solved these Questions
- DATA HANDLING BOOK - MTG IIT JEE FOUNDATIONCHAPTER - DATA HANDLING EXERCISE - NCERT Section (Exercise 9.1)
22 Videos
- DATA HANDLING BOOK - MTG IIT JEE FOUNDATIONCHAPTER - DATA HANDLING EXERCISE - NCERT Section (Exercise 9.2)
5 Videos
- DATA HANDLING BOOK - MTG IIT JEE FOUNDATIONCHAPTER - DATA HANDLING EXERCISE - Olympiad/HOTS Corner
10 Videos
- BASIC GEOMETRICAL IDEASBOOK - MTG IIT JEE FOUNDATIONCHAPTER - BASIC GEOMETRICAL IDEASEXERCISE - OLYMPIAD/HOTS CORNER
10 Videos
- DECIMALSBOOK - MTG IIT JEE FOUNDATIONCHAPTER - DECIMALSEXERCISE - OLYMPIAD/HOTS CORNER
20 Videos
Similar Questions
The following table represents income of a Gram Panchayat from different sources in a particular year:
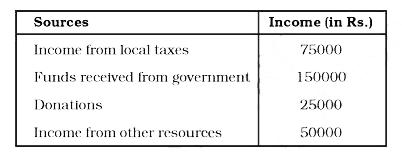
Draw a bar graph to represent the above information
View SolutionThe following bar graph shows the number of students in different classes of a school.
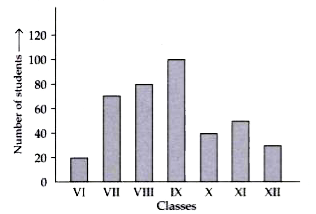
How many more students are there in Class IX than in Class VIII ?
View Solution
Knowledge Check
The following bar graph shows the number of students in a particular class of school. Then, answer the following questions.
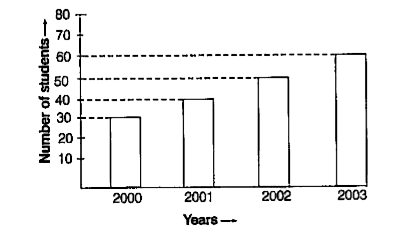
Is the number of students in the year 2002 is twice that in the year 2000?AYesBNoCCannot sayDNone of theseThe following bar graph shows the number of students in a particular class of school. Then, answer the following questions.
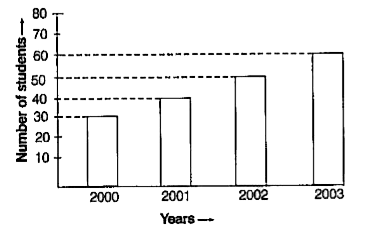
What is the number of students in the year 2003?A10B25C45D60
The given bar graph, shows the number of students in different classes.
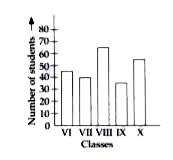
How many more students are there in class VIII than in class IX?
View SolutionThe following table shows the number of students in different classes of a high school. Draw a histogram to represent the given data.
ClassesVIVIIVIIIIXXNumber of students3742355048
View SolutionThe given table shows the number of tourists who visited Taj Mahal during different months. Month

Draw a bar graph to represent the above information by using appropriate scale.
View SolutionThe following data shows the number of students who attended the school on weekdays. Draw a bar graph to represent information by using appropriate scale.

View Solution. The following data shows the year wise strength of a school.Represent the the above data by bar graph:
View SolutionThe following bar graph shows the number of students in a particular class of school. Then, answer the following questions.
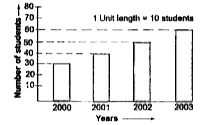
What is the number of students in the year 2003?
View Solution
