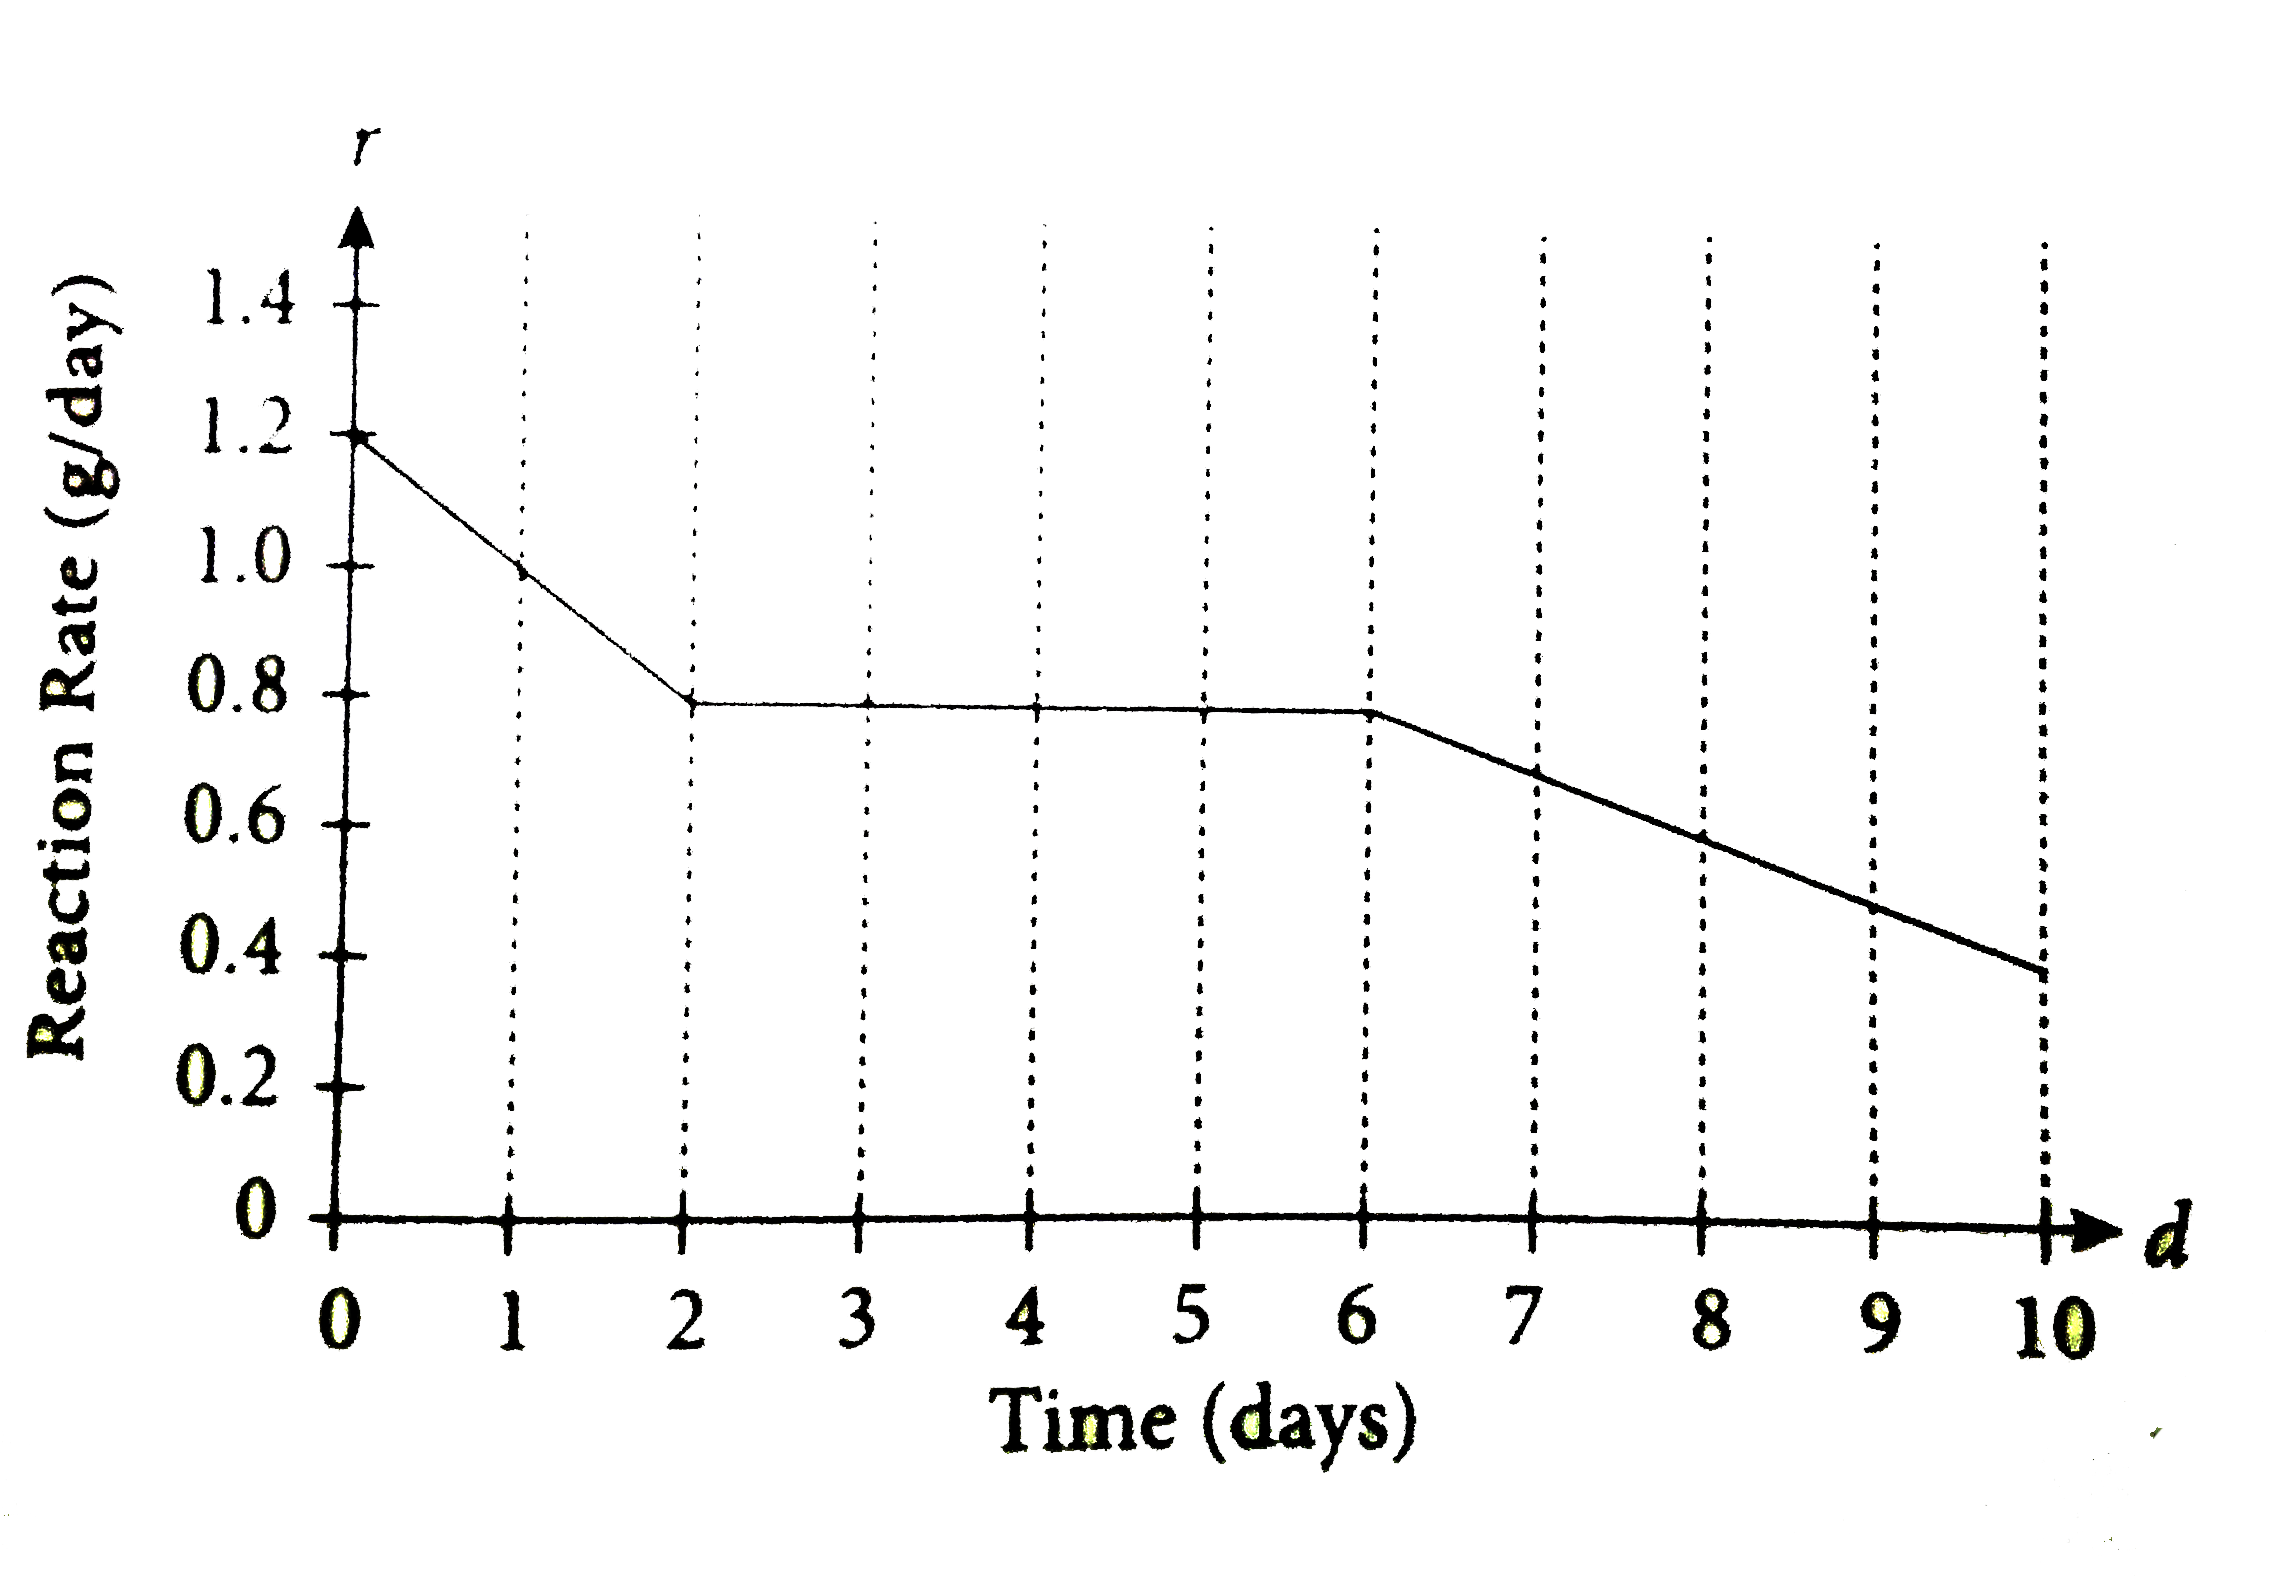
the graph above represents the reaction rate,r, at which an unfinished iron nail rists in water during the first 10 days of an experiment, where d gives time measured in days. What was the total amount of rust produced from d=2 to d=6?
0.8 grams
1.6 grams
2.4 grams
3.2 grams
The correct Answer is:D
Step by step video, text & image solution for the graph above represents the reaction rate,r, at which an unfinished iron nail rists in water during the first 10 days of an experiment, where d gives time measured in days. What was the total amount of rust produced from d=2 to d=6? by Maths experts to help you in doubts & scoring excellent marks in Class 12 exams.
Updated on:21/07/2023Topper's Solved these Questions
Similar Questions
The following bar graph shows the number of vehicles passing through a road crossing in Delhi in different time intervals on a particular day. Read the bar graph and answer the following questions: What does the bar graph represent? Also, give the maximum number of vehicles. When is the hourly traffic maximum? Also give the minimum number of vehicles. When is the hourly traffic minimum? What is the total number of vehicles passing through a crossing during a particular day?
View SolutionThe following graph shows the temperature forecast and the actual temperature for each day of a week.(a) On which days was the forecast temperature the same as the actual temperature? (b) What was the maximum forecast temperature during the week?(c) What was the minimum actual temperature during the week?(d) On which day did the actual temperature differ the most from the forecast temperature?
View Solution
Knowledge Check
Suppose the evaporation rate of water in a lake is given by the equation E=Ta−Tb700−VTwh4, where E is the evaporation rate in gallons/day. Ta is the air temperature, Td is the dew point temperature, V is the volume of water in the table, Tw is the water temperature, and h is the number of hours the water is exposed to sunlight. Which of the following expresses Tw in terms Ta,Tb,V,E,andh?
ATw=Eh4(Ta−Tb)VBTw=700Ta−Td−Eh4VCTw=V4(Ta−Tb)Eh4DTw=VTa−Td700−Eh4Luciano measured the amount of water that evaporated over a period of time from a container holding w ounces of water, where w is greater than 12. By the end of the first day, the cub had lost 2 ounces of water. By the end of the 7th day, the cup had lost an additional 8 ounces of water. By the end of the 11th day, the cup had lost half of the water that remained after the 7th day. Which of the following represents the remaining amount of water, in ounces, in Luciano's container at the end of the 11th day?
Aw−28Bw−22−10C12w−10Dw−102
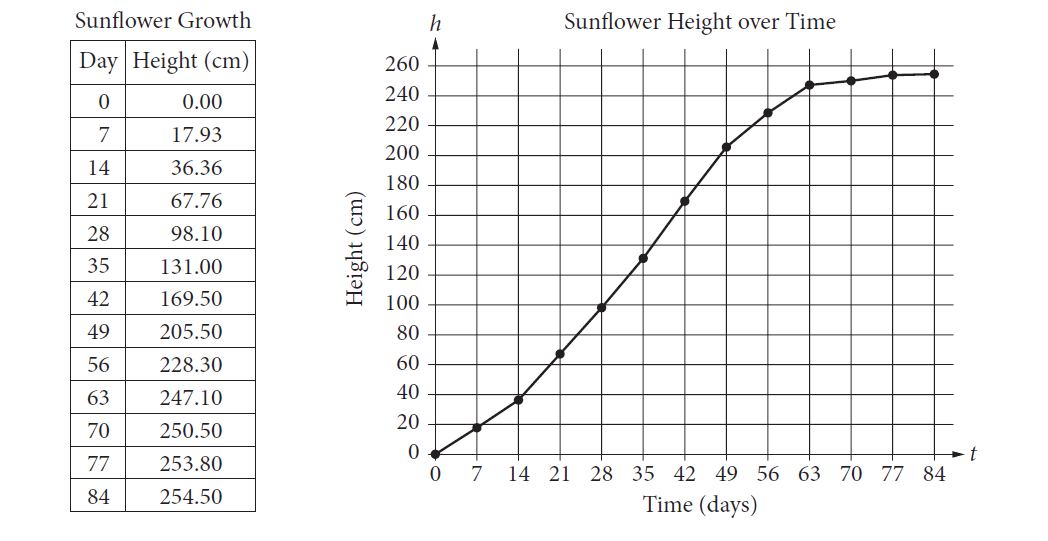
In 1919, H. S. Reed and R. H. Holland published a paper on the growth of sunflowers. Included in the paper were the table and graph above, which show the height h, in centimeters, of a sunflower t days after the sunflower begins to grow.
The function h, defined by h(t) = at + b , where a and b are constants, models the height, in centimeters, of the sunflower after t days of growth during a time period in which the growth is approximately linear. What does a represent?AThe predicted number of centimeters the sunflower grows each day during the periodBThe predicted height, in centimeters, of the sunflower at the beginning of the periodCThe predicted height, in centimeters, of the sunflower at the end of the periodDThe predicted total increase in the height of the sunflower, in centimeters, during the period
Scientists are working hard to develop nuclear fusion reactor Nuclei of heavy hydrogen, _(1)2H , known as deuteron and denoted by D, can be thought of as a candidate for fusion rector . The D−D reaction is _(1)2H+21H→12He+n+ energy. In the core of fusion reactor, a gas of heavy hydrogen of _(1)2H is fully ionized into deuteron nuclei and electrons. This collection of _12H nuclei and electrons is known as plasma . The nuclei move randomly in the reactor core and occasionally come close enough for nuclear fusion to take place. Usually , the temperature in the reactor core are too high and no material will can be used to confine the to plasma for a time t0 before the particles fly away from the core. If n is the density (number volume ) of deuterons , the productnt0is called Lawson number. In one of the criteria , a reactor is termed successful if Lawson number is greater then 5×10¹⁴s/cm2
it may be helpfull to use the following boltzmann constant
λ=8.6×10⁻⁵eV/k,e24πs0=1.44×10−9eVm
Result of calculations for four different design of a fusion reactor using D−D reaction are given below. which of these is most promising based on Lawson criterion ?
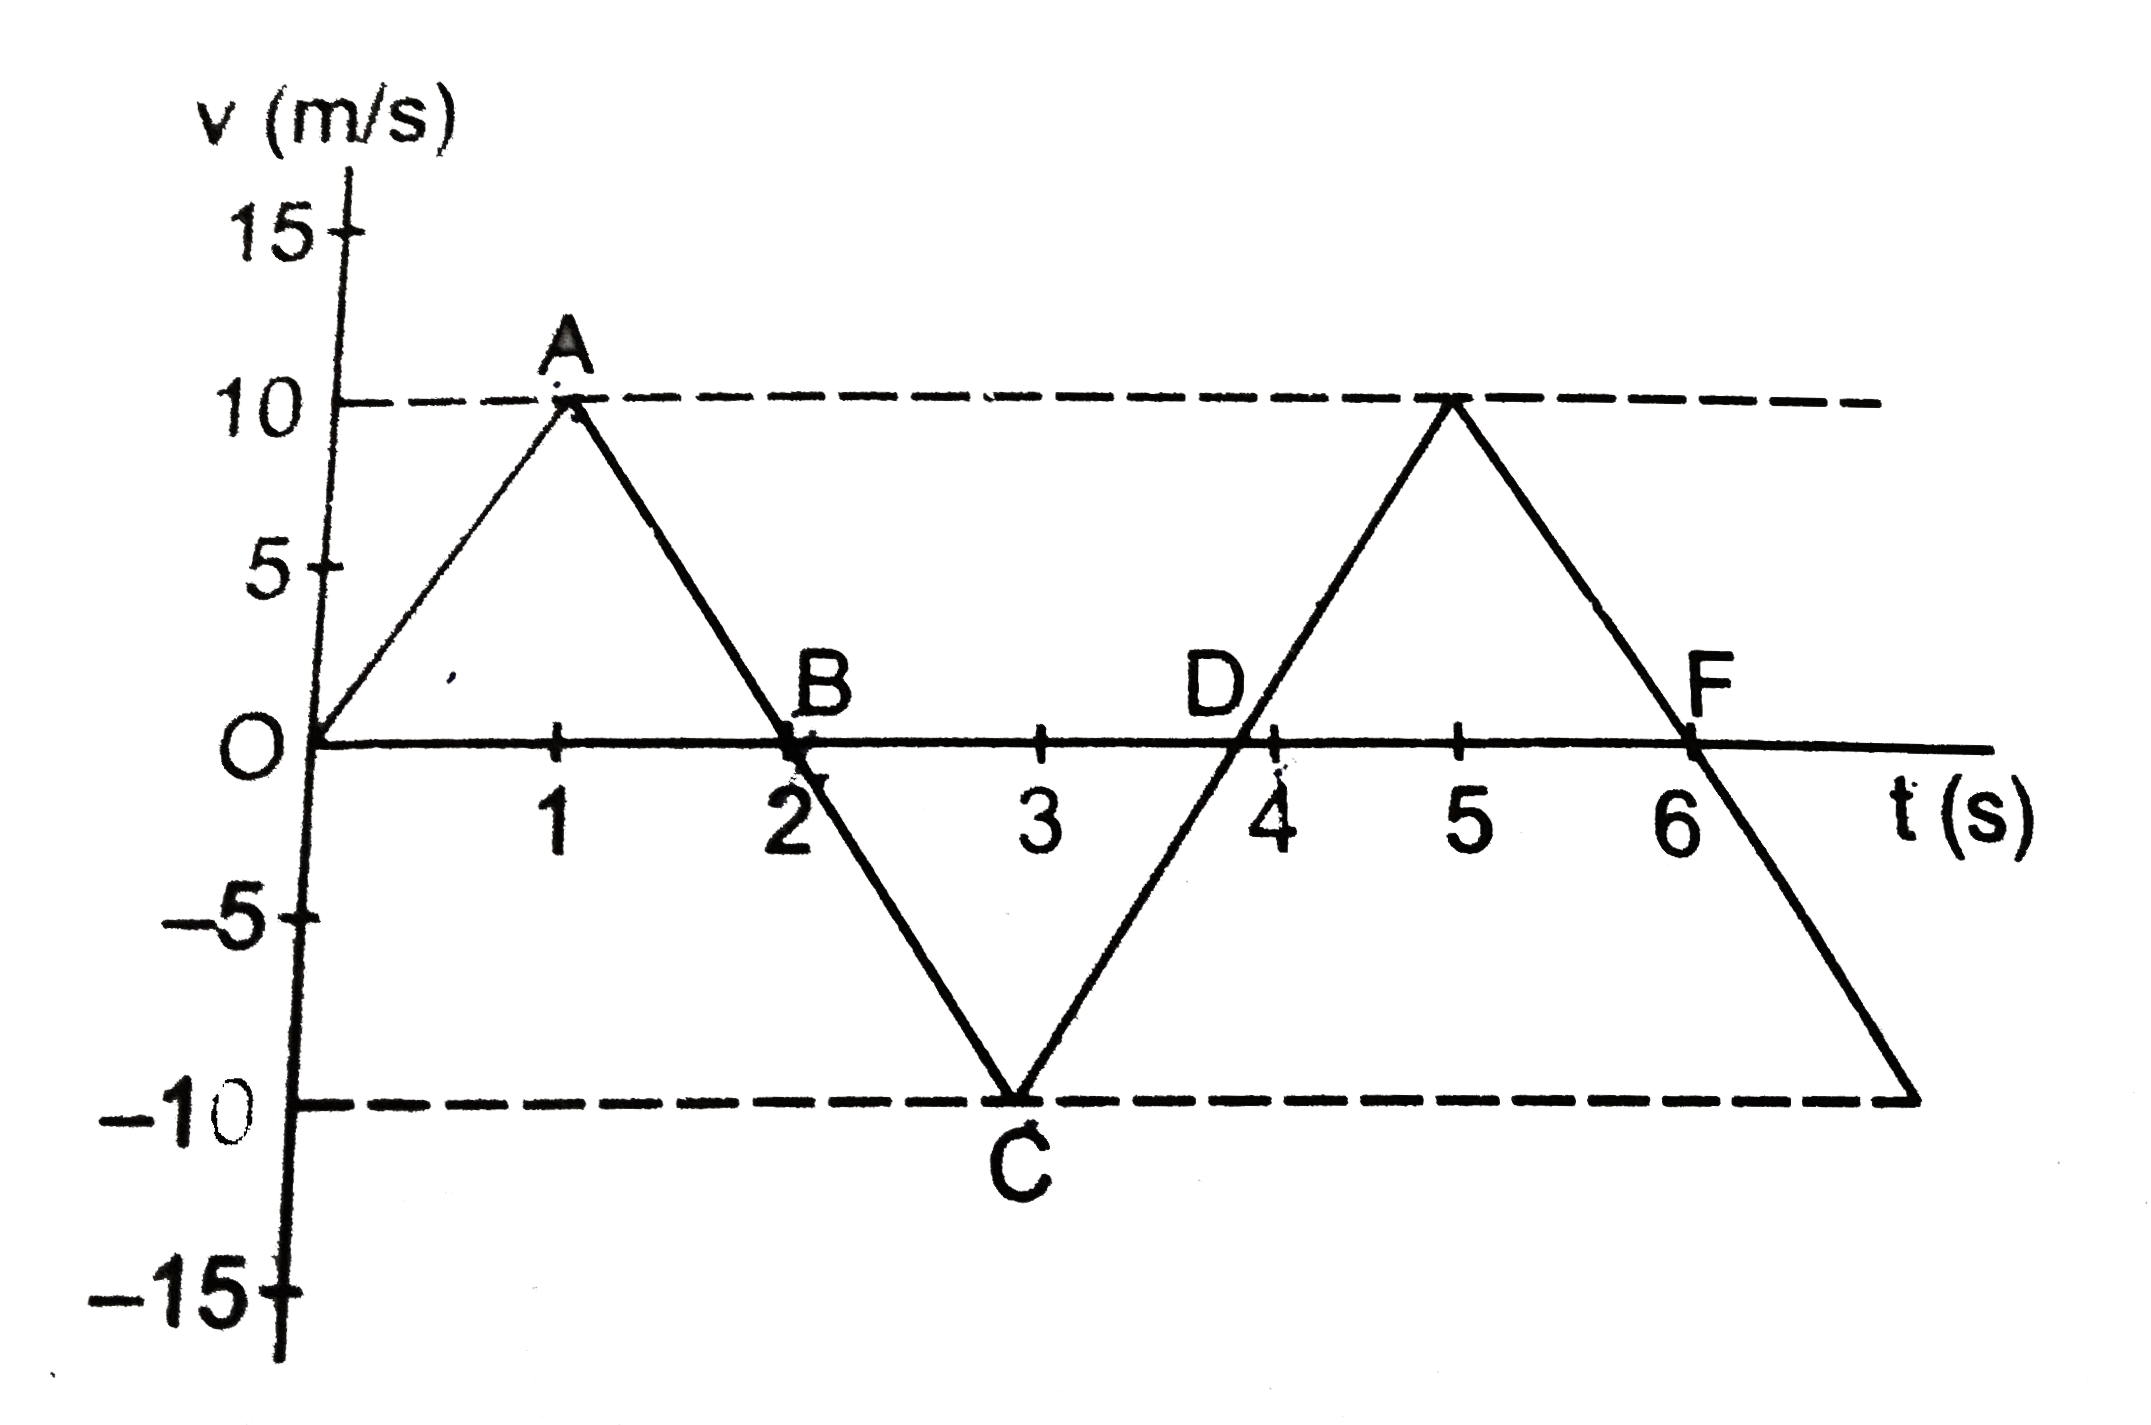
View SolutionFrom the veloicty time graph of a particle given in figure describe the motion of the particle qualitively int eh interval 0 to 4s. Find a. the distance travelled during first two seconds, b. during the time 2s to 4s, c. during the time 0 to 4s d. displacement during 0 to 4 s. e. acceleration at t=1/2 and f. acceleration at t=2s
 .
.
View SolutionAn impluse laser may be treaed as a source of phtons that are emitted during the time interval of the pulse which is followrd by a time interval when no photons are produced. Pulse are periodically repeated. A laser beam of diameter d=10 microns is directed upward and is perpendicular to the then foil surface which has an index of reflectionρ=0.50 (see the sketch of the experiment). The index of reflection of the surface is the ratio of the relected energy of foil that can be supported in the air solely by the light pressure of the laser beam ?
_E01_018_Q01.png)
View SolutionFor the reaction
5Br−(aq)+BrO−3(aq)+6H+(aq)→3Br2(aq)+3H2O(l)
the reate expression was found to be −d[BrO3−]dt=k[Br−][H+]2[BrO−3]
Which of the following statements is /are correct?
I. Doubling the intial concentration of all the reactants will increase the reaction rate by a factor of 8.
II. Unit of rate constant of the reaction in a buffer solution is min−1
III. Doubling the concentration of all the reactants at the same time will increase the reaction rate by a factor of 16
IV. rate of conversion of BrO−3 and rate of disappearance of Br− are the same
View SolutionA small bottle contains powered beryllium Be & gaseous radon which is used as a source of α-particles. Netrons are produced when α−particles of the radon react with beryllium. The yield of this reaction is (1/4000) i.e. only one α-particle out of induced the reaction. Find the amount of radon (Rn222) originally introduced into the source, if it prouduces 1.2×10⁶ neutrons per second after 7.6 days. [T1/2 of Rn=3.8 days]
View Solution
