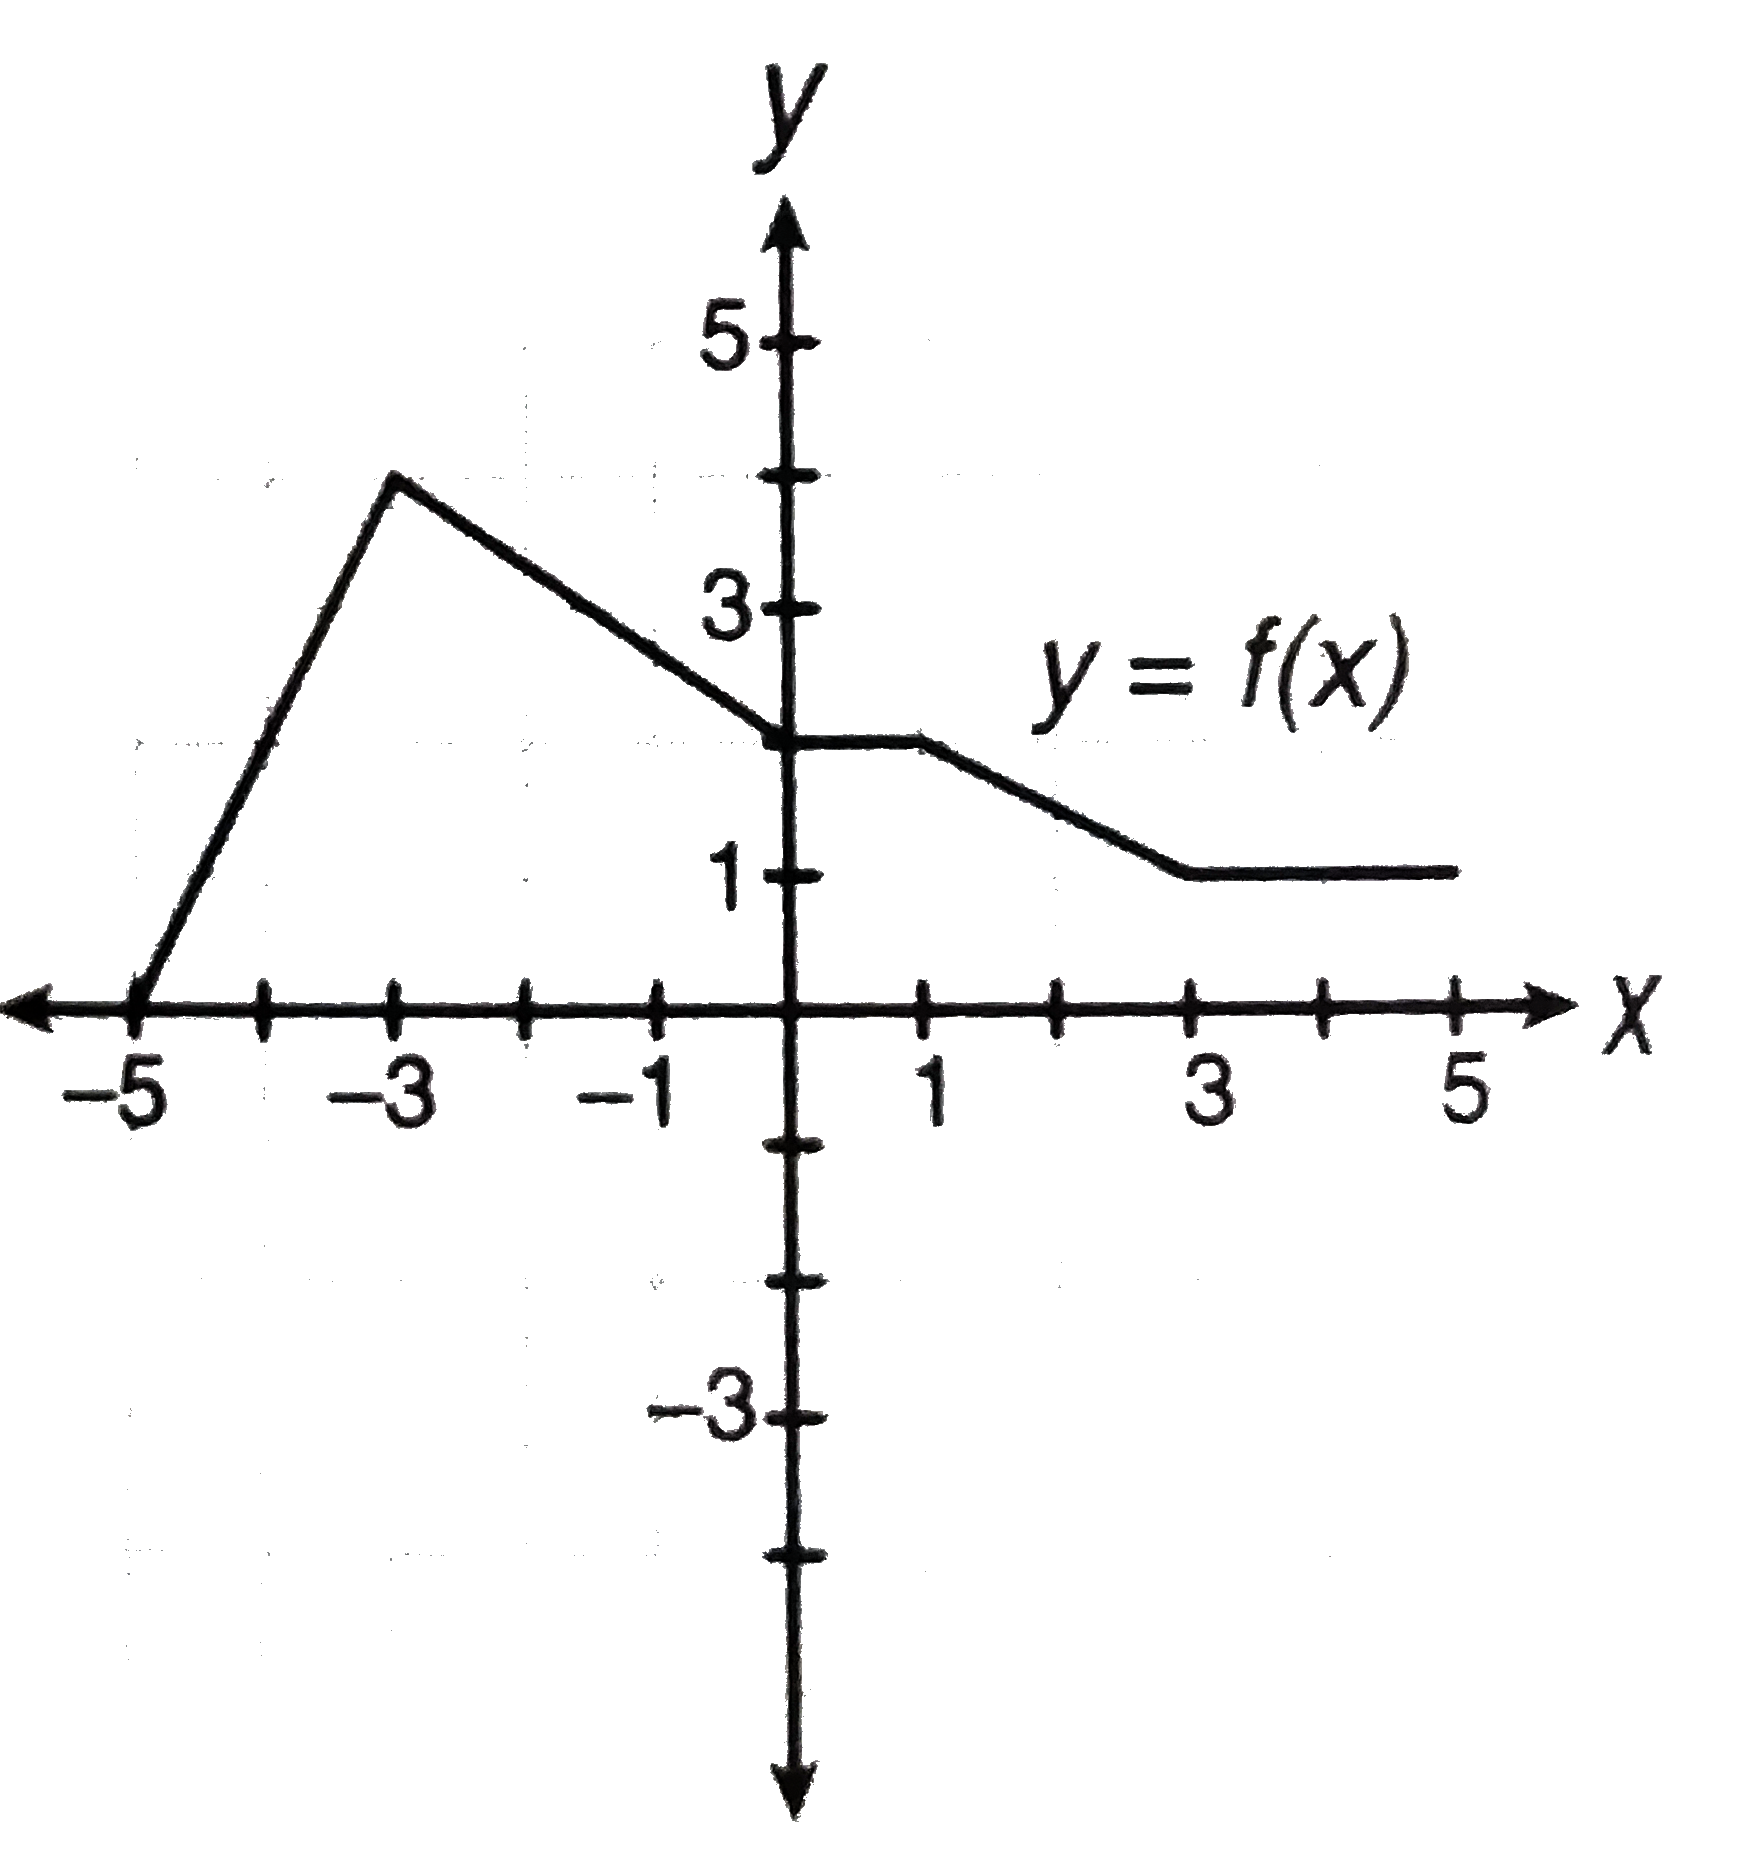
The graph of function f over the interval −5≤x≤5 is shown I the figure sbove. If f(w)=2andw>0, what is one possible value of w?
Step by step video & image solution for The graph of function f over the interval -5 le x le 5 is shown I the figure sbove. If f(w)=2 and w gt0, what is one possible value of w? by Maths experts to help you in doubts & scoring excellent marks in Class 12 exams.
Updated on:21/07/2023Topper's Solved these Questions
Similar Questions
Knowledge Check
If 35 w = 43, what is the value of w?
A920B45C54D209Two real numbers or two algebraic expressions related by the symbols >,<,≤or≥ form an inequation. If the highest power of the variables used in the inequation is 1, then the inequation is called linear inequation. For the linear inequation 3x−5≤8, answer teh following questions.
If x∈W, then the smallest value of x is:A0B1C2D4
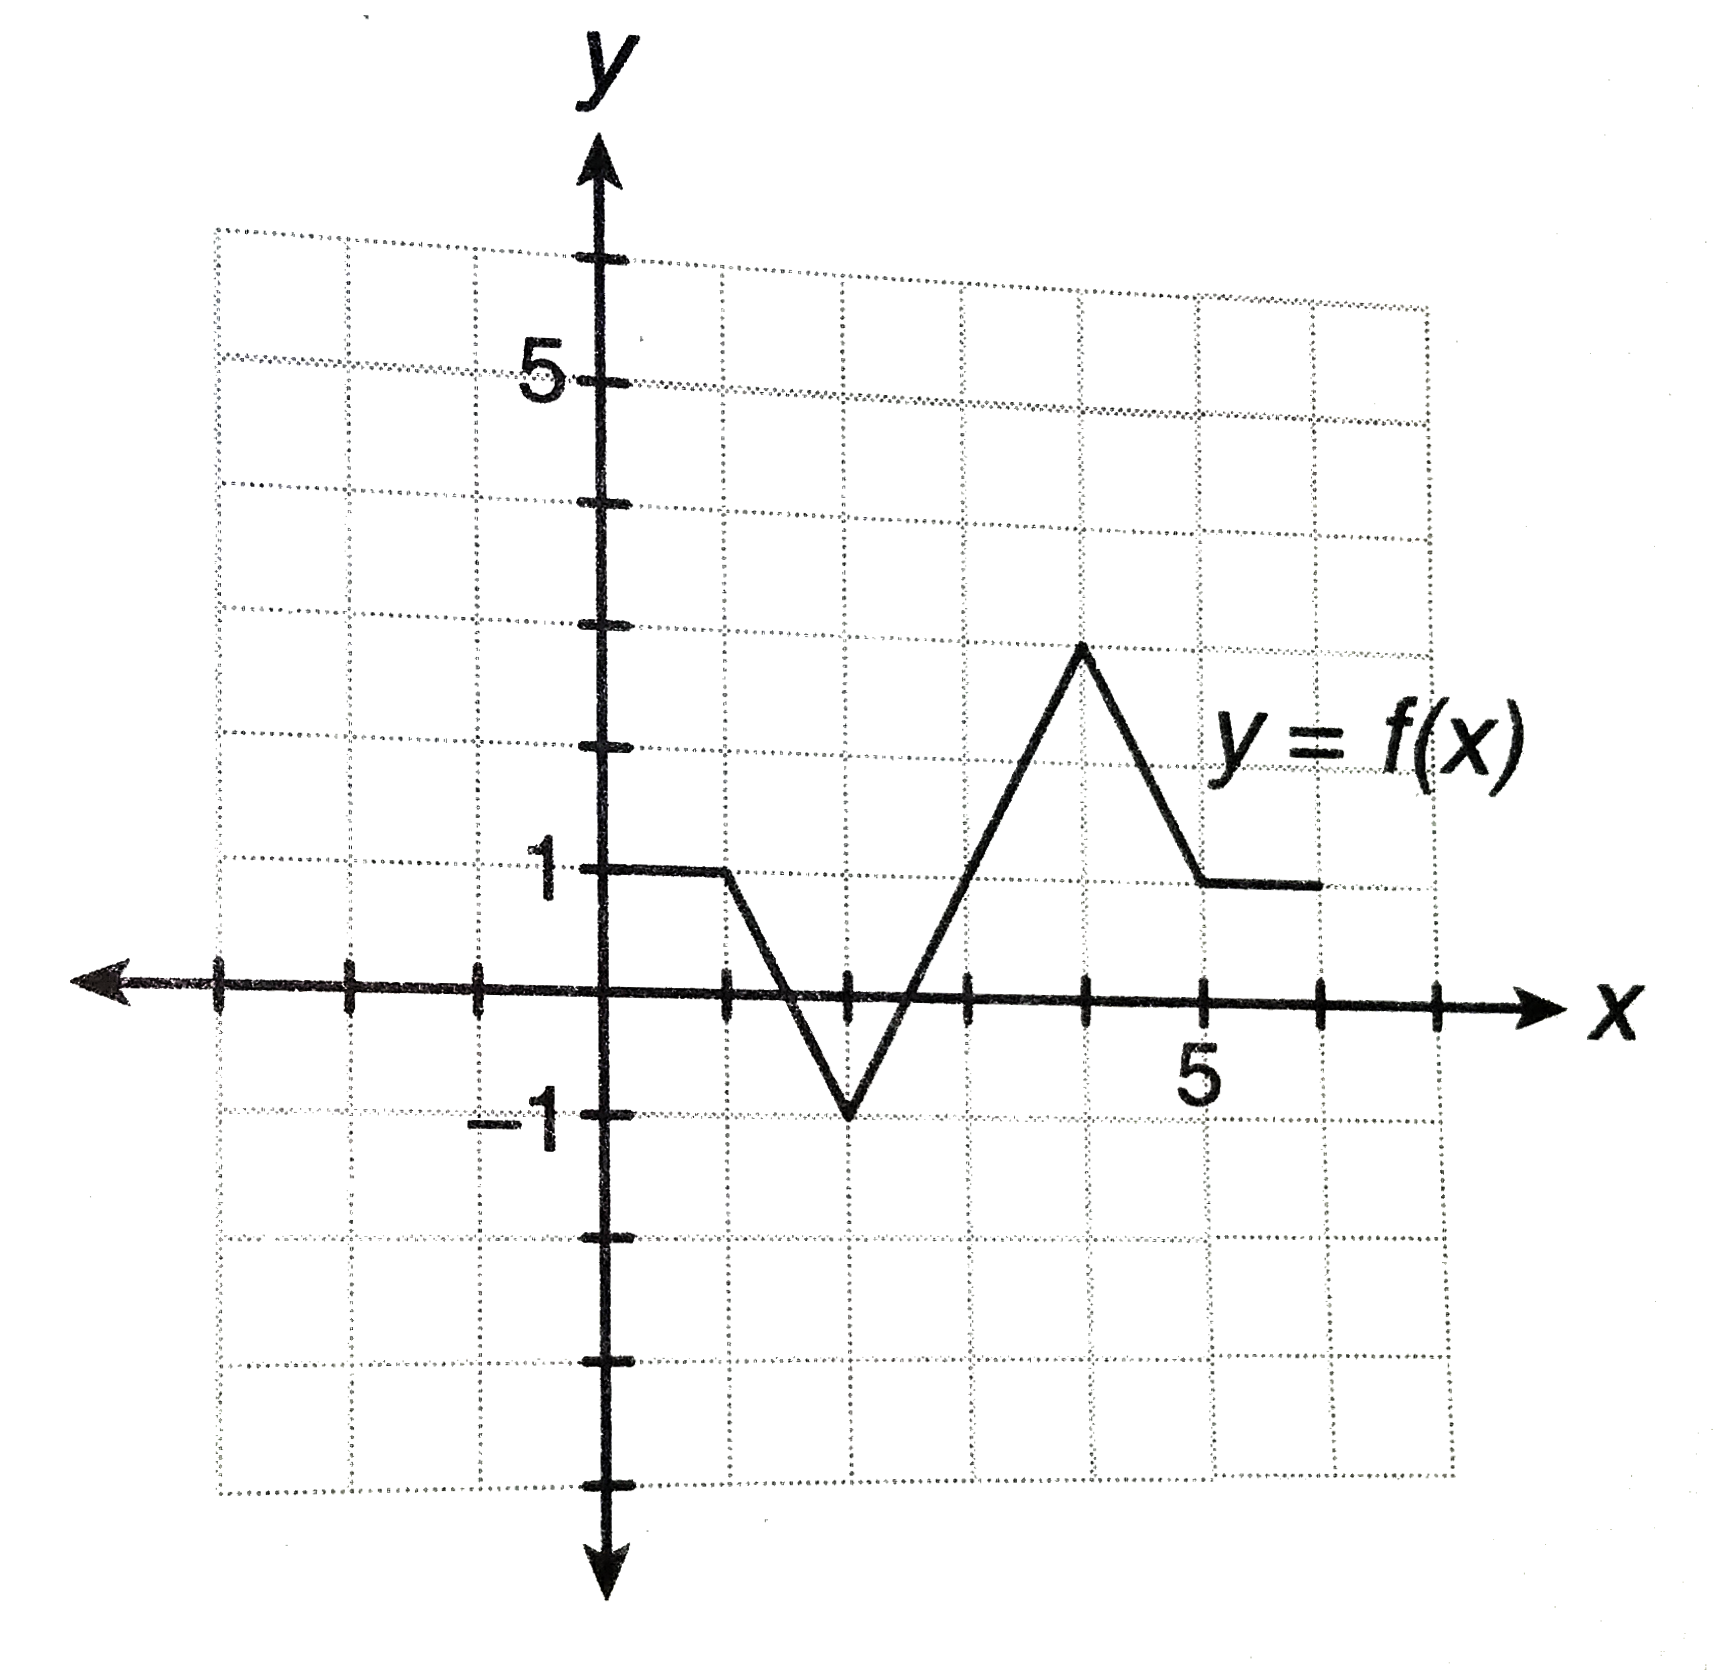
The figure above shows part of the graph of function f. If f(x−5)=f(x) for all values of x, what is the value of f(19)?A−1B0C1D3
If 4 is a root of x2−x−w=0, what is the value of w?
View SolutionIf a and b are integers and −4≤a≤3and−4≤b≤5, what is the maximum possible value for ab?
View SolutionDraw the graph of the function f(x)=x−∣∣x−x2∣∣,−1≤x≤1 and discuss the continuity or discontinuity of f in the interval −1≤x≤1
View SolutionA function f is differentiable in the interval 0≤x≤5 such that f(0) =4& f(5) =- If g (x) =f(x)x+1, then prove that there exists some c∈(0,5) such that g(c) =−56
View SolutionSolve and graph the solution set on a number line :
3x−1>5,x∈W
View Solution

