The graph of function y=f(x) has a unique tangent at (ea,0) through which the graph passes, then limx→ealog(1+7f(x))−sin(f(x))3f(x) equals
1
3
2
7
The correct Answer is:C
Step by step video solution for The graph of function y=f(x) has a unique tangent at (e^(a),0) through which the graph passes, then lim_(xtoe^(a))(log(1+7f(x))-sin(f(x)))/(3f(x)) equals by Maths experts to help you in doubts & scoring excellent marks in Class 12 exams.
Topper's Solved these Questions
- BOOK - VK JAISWAL ENGLISHCHAPTER - APPLICATION OF DERIVATIVES EXERCISE - EXERCISE (ONE OR MORE THAN ANSWER IS/ARE CORRECT )29videos
APPLICATION OF DERIVATIVES
- BOOK - VK JAISWAL ENGLISHCHAPTER - APPLICATION OF DERIVATIVES EXERCISE - EXERCISE (COMPREHENSION TYPE PROBLEMS)15videos
APPLICATION OF DERIVATIVES
- BOOK - VK JAISWAL ENGLISHCHAPTER - AREA UNDER CURVESEXERCISE - EXERCISE (SUBJECTIVE TYPE PROBLEMS)8videos
AREA UNDER CURVES
Similar Questions
The graph of the function y=f(x) has a unique tangent at the point (ea,0) through which the graph passes then lim–––––(x→ea)loge{1+7f(x)}−sinf(x)3f(x)
View SolutionThe graph of the function y=f(x) has a unique tangent at the point (a,0) through which the graph passes. Then evaluate
limx→aloge{1+6f(x)}3f(x).View SolutionIf the graph of the function y=f(x) has a unique tangent at the point (a,0) through which the graph passes, then evaluate (lim)x→a(log)e{1+6f(x)}3f(x)
View SolutionIf the graph of the function y=f(x) has a unique tangent at point (ea,0) (not vertical, non-horizontal) on the graph, then evaluate limx→ealoge((1+9f(x))−tan(f(x)))2f(x).
View SolutionIf graph of the function y=f(x) is continuous and passes through point (3, 1) then limx→3loge(3f(x)−2)2(1−f(x)) is equal
View SolutionIf graph of the function y=f(x) is continuous and passes through point (3,1) then (lim)x→3(log)e(3f(x)−2)2(1−f(x)) is equal 32 b. 12 c. −32 d. −12
View Solutionif the graph of the cont. function y=f(x) passes through the point (a, 0) and f(x)≠0 in the deleted neighbourhood of a then (lim)x→alog{6f2(x)−3f(x)+1}3f(x)= (A) 2 (B) 1 (C) -1 (D) none of these
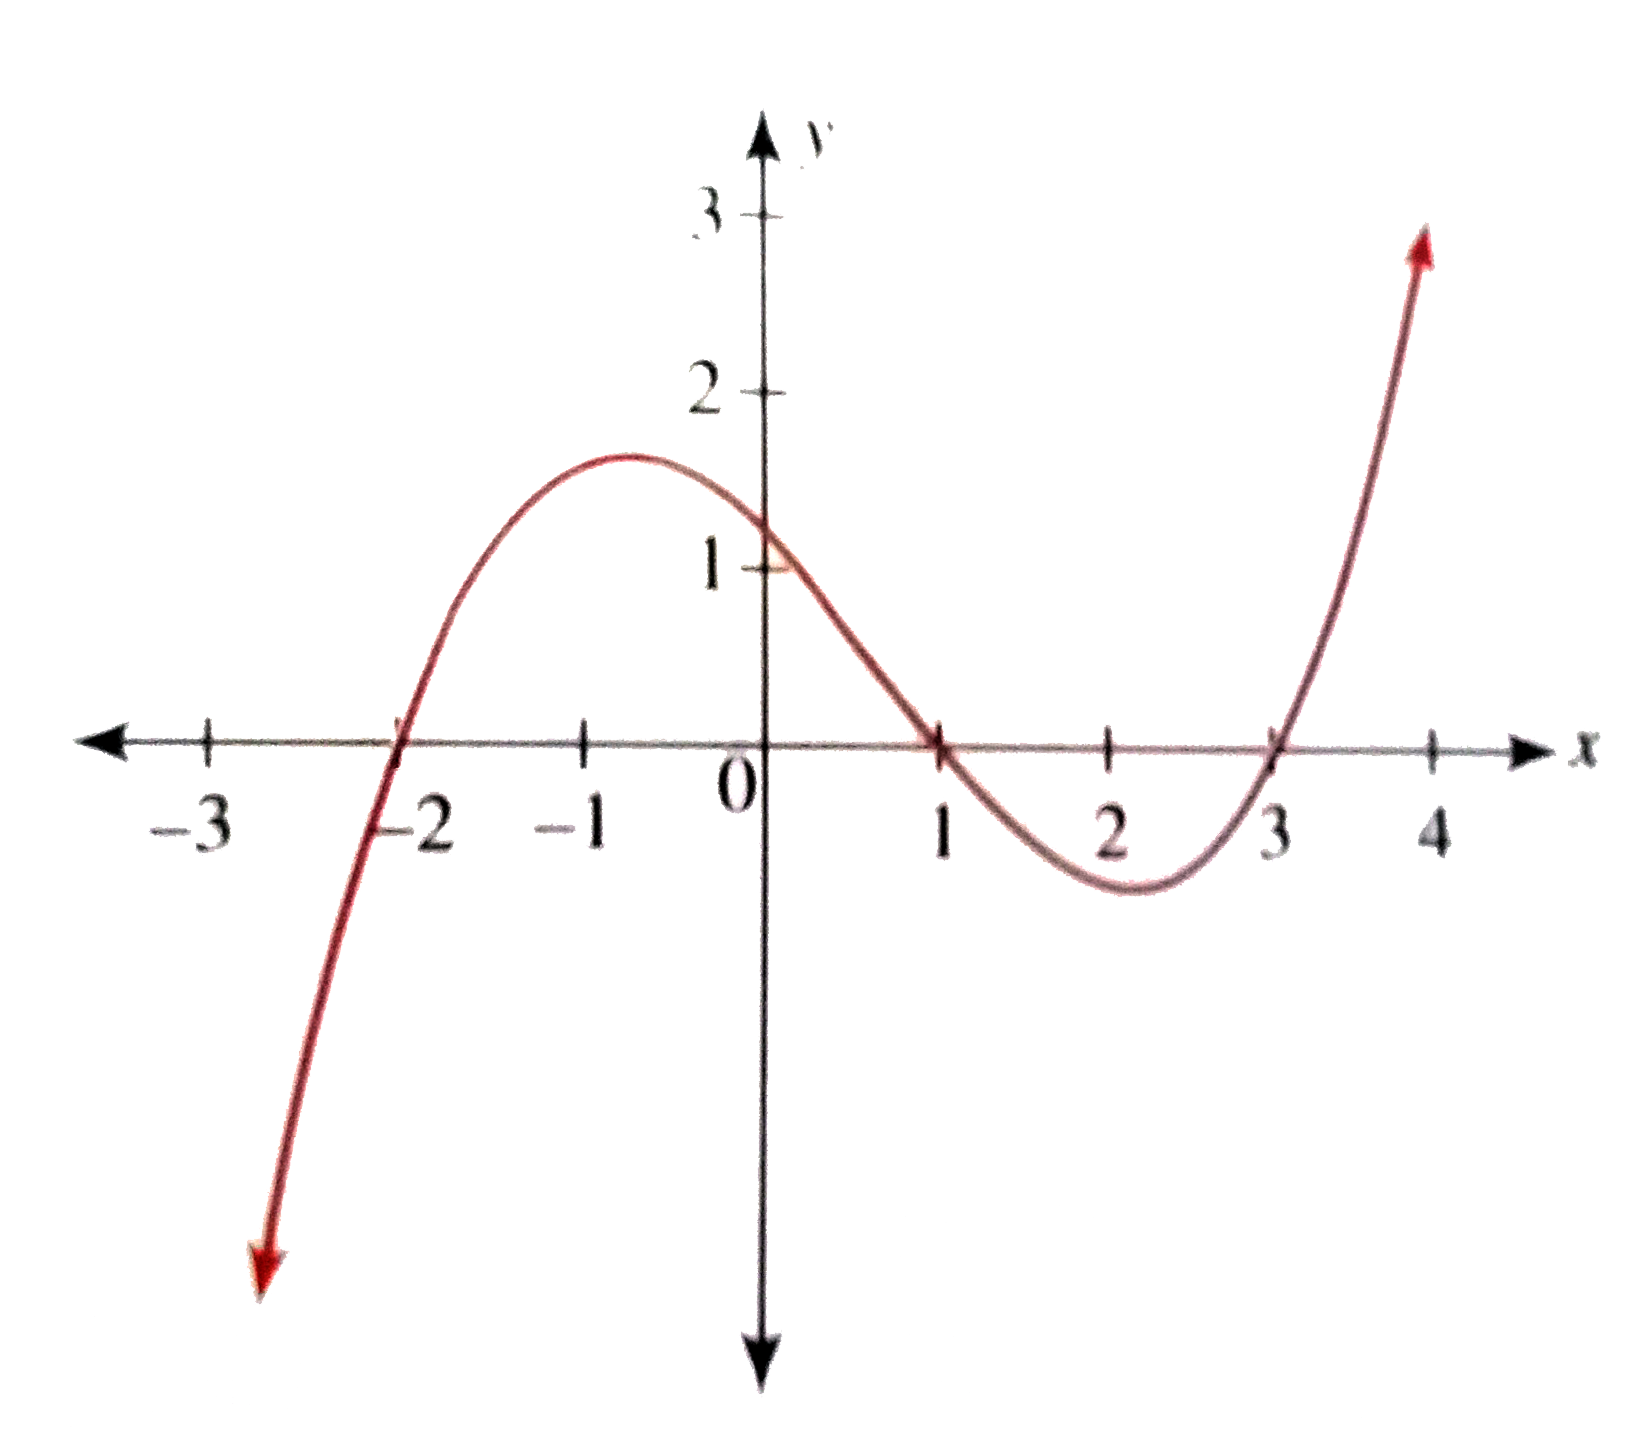
View SolutionThe graph of the function y=f(x) is as shown in the figure.

Then draw the graphs of
(i) |y|=sgn(f(x)) (ii) |y|=|f(x∣)|
(iii) y=xsgn(f(x))View SolutionDraw the graph of the function f(x)=|x−1|
View SolutionThe graph of function f(x) is shown below :

Then the graph of g(x)=1f(|x|) is:View Solution

