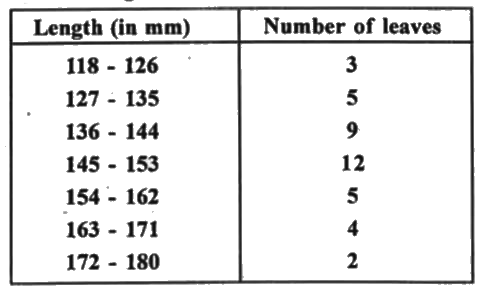
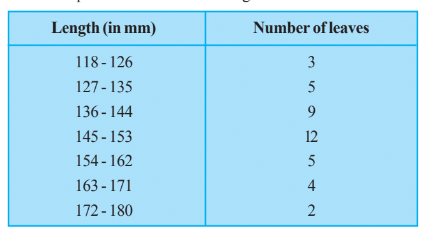
The length of 40 leaves of a plant are measured correct to one millimetre, and the obtained data is represented in the following table :

(iii) Is it correct to conclude that the maximum number of leaves are 153 mm long ? Why ? Solution in Kannada
Step by step video & image solution for The length of 40 leaves of a plant are measured correct to one millimetre, and the obtained data is represented in the following table : (iii) Is it correct to conclude that the maximum number of leaves are 153 mm long ? Why ? by Maths experts to help you in doubts & scoring excellent marks in Class 9 exams.
Topper's Solved these Questions
Similar Questions
The blood groups of 30 students of class VIII are recorded as follows :
A,B,O,O,AB,O,A,O,B,A,O,B,A,O,O,A,AB,O,A,A,O,O,AB,B,A,O,B,A,B,O.
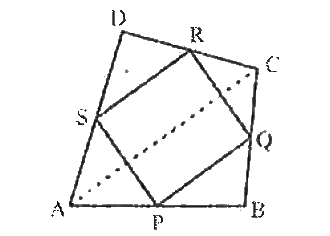
Represent this data in the form of a frequency distribution table. Which is the most common, and which is the rarest, blood group among these students ?08:09View SolutionABCD is a quadrilateral in which P, Q, R and S are mid- points of the sides AB, BC, CD and DA. AC is a diagonal. Show that :
SR|A|C and SR=12AC
 View Solution
The diameter of a sphere is decreased by 25%. By what per cent does its curved surface area decrease ?
06:07View SolutionThe length of 40 leaves of a plant are measured correct to one millimeter, and the obtained data is represented in the following table:

(i) Draw a histogram to represent the given data.
(ii) Is there any other suitable graphical representation for the same data?
(iii) Is it correct to conclude that the maximum number of leaves are 153 mm long?Why?02:11View SolutionThe length of 40 leaves of a plant measured correct to one millimetre and the obtained data is represented in the following table:

(i) Draw a histogram to represent the given data.
(ii) Is there any other suitable graphical representation for the same data?
(iii) Is it correct to conclude that the maximum number of leaves 153 mm long and why?02:45View SolutionWhich of the following are correct chain isomers of butane ? (i)
02:17View SolutionDetermine the point of symmetry of a regular hexagon.
05:41View SolutionMatch the following Column A to Column B
 02:10View Solution
Match the following Column A to Column B
 02:17View Solution
Match the following Column A to Column B
 02:10View Solution
The inequation represented by the graph given below is :
02:41View SolutionThe inequation that best describes the graph given below is _________
08:54View SolutionThe inequation that best describes the following graph is _________
04:39View SolutionFrom the following figure, the correct observation is :- ltimg src="https://d10lpgp6xz60nq.cloudfront.net/physics_images/ALN_PHY_R03_E08_015_Q01.png" width="80%"gt
04:40View SolutionThe length of 40 leaves of a plant are measured correct to one millimetre, and the obtained data is represented in the following table: (i) Draw a histogram to represent the given data.(ii) Is there any other suitable graphical representation for the same data?(iii) Is it correct to conclude that the maximum number of leaves are 153 mm long?Why?
02:41View Solution

