The line graph given below shows the production of a particular model of bike produced in different months. Read the line graph and answer the following questions:
In which month is the production least?
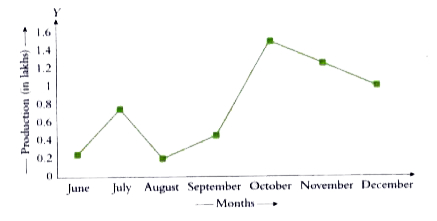
The correct Answer is:August
Step by step video & image solution for The line graph given below shows the production of a particular model of bike produced in different months. Read the line graph and answer the following questions: In which month is the production least? by Maths experts to help you in doubts & scoring excellent marks in Class 7 exams.
Similar Questions
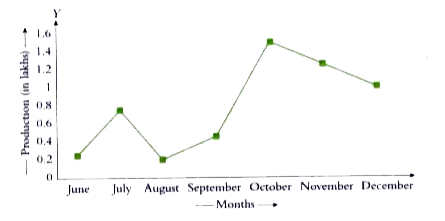
The line graph given below shows the production of a particular model of bike produced in different months. Read the line graph and answer the following questions:
In which month is the production maximum?
 View Solution
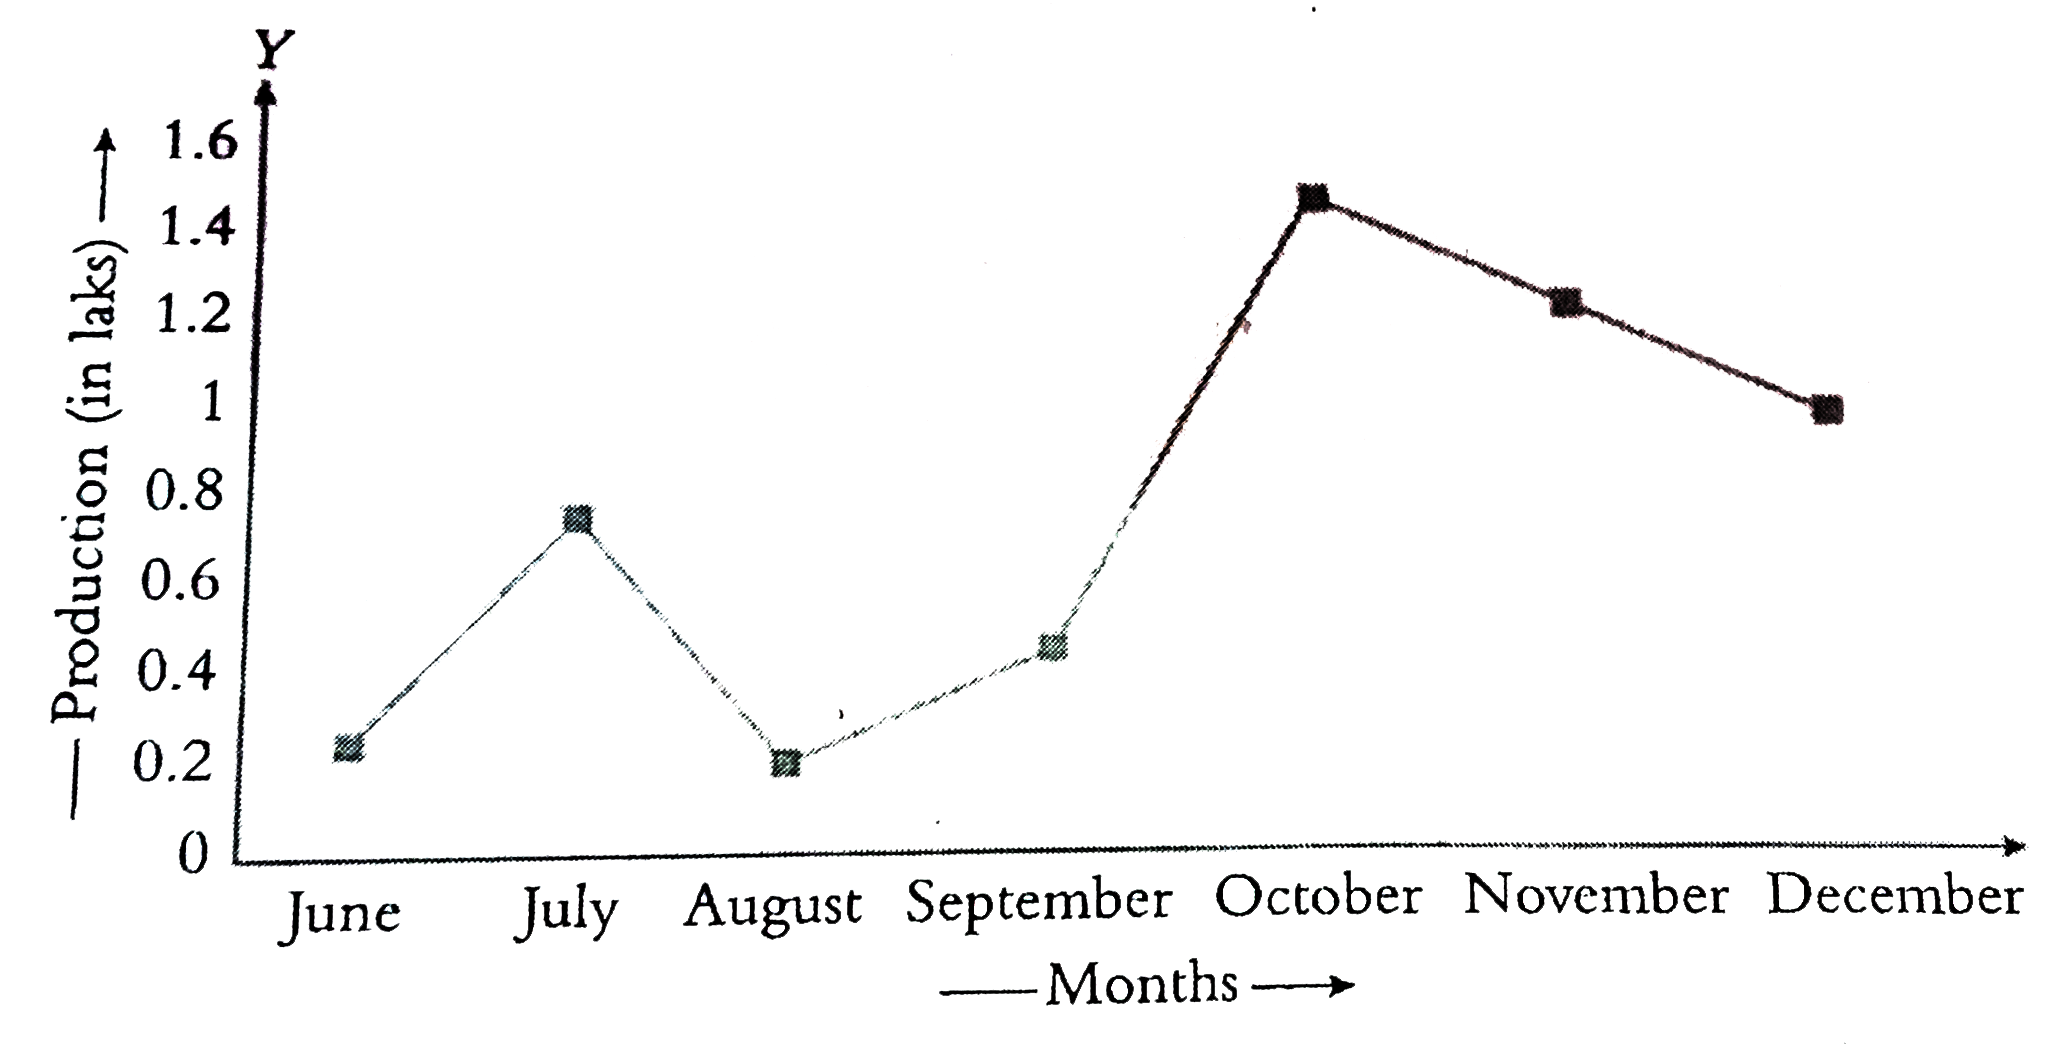
The line graph given below shows the production of a particular model of bike [roduced in different months. Read the line graph and answer the following questions :
(a) In which month is the production maximum ?
(b) In which month is the production least ?
(c) In which two successive months has the production increased ?
(d) In which two successive months has the production decreased ?
 View Solution
Knowledge Check
- Question 1 - Select One
The line graph shows the production of steel of a certain country. Study the diagram and answer the following questions.
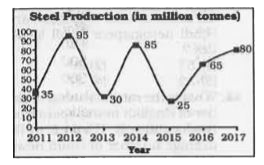
In which year was the steel production lesser than that of the previous year?A2013B2014C2012D2016 - Question 2 - Select One
The line graph shows the production of steel of a certain country. Study the diagram and answer the following questions.
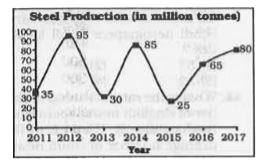
What was the difference (in million tonnes) in the steel production between the years 2011 and 2015?A10B5C15D20 - Question 3 - Select One
The pie chart given below shows the spending of a family on various heads during a month. Study the graph and answer the following questions.
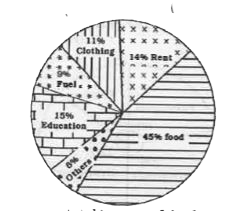
Which three expenditures together have a central angle of 108∘?AFuel, Clothing and OthersBFuel, Education and OthersCClothing, Rent and OthersDEducation, Rent and Others
The line graph given below shows the production of a particular model of bike produced in different months. Read the line graph and answer the following questions:
In which two successive months has the production increased?
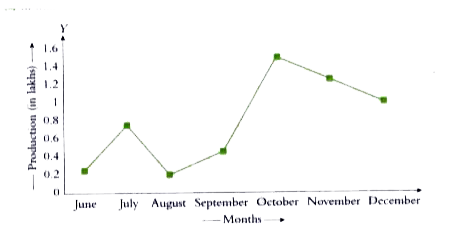 View Solution
The line graph given below shows the production of a particular model of bike produced in different months. Read the line graph and answer the following questions:
In which two successive months has the production decreased?
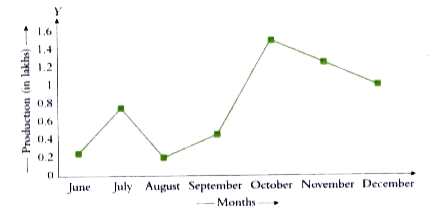 View Solution
Read the graph and answer the following questions
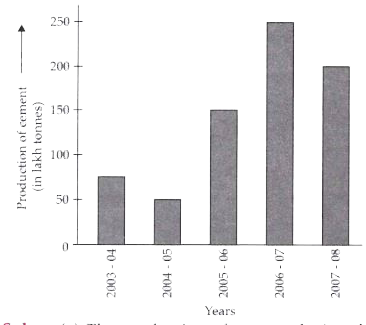
During which period, the production was minimum ?View SolutionLook at the bar graph and answer the following questions.
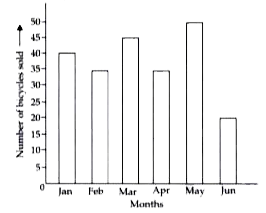
In which month 40 bicycles were sold?View SolutionRead the following bar graph given in figure and answer the following questions.
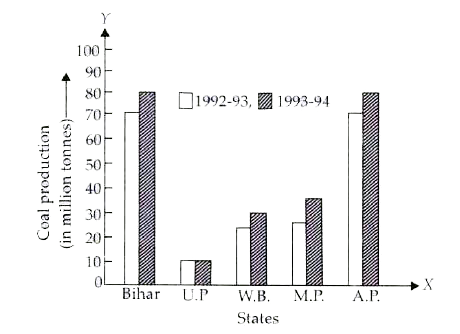
Which state has minimum production?View Solution
