Read the graph and answer the following questions
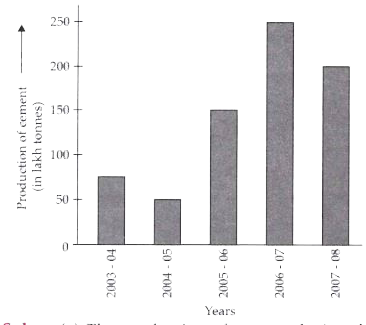
During which period, the production was minimum ?
The correct Answer is:2000-05
Step by step video, text & image solution for Read the graph and answer the following questions During which period, the production was minimum ? by Maths experts to help you in doubts & scoring excellent marks in Class 7 exams.
Updated on:21/07/2023Topper's Solved these Questions
- DATA HANDLINGBOOK - MTG IIT JEE FOUNDATIONCHAPTER - DATA HANDLINGEXERCISE - NCERT Section (Exercise - 3 .1 )
23 Videos
- DATA HANDLINGBOOK - MTG IIT JEE FOUNDATIONCHAPTER - DATA HANDLINGEXERCISE - NCERT Section (Exercise - 3 .2 )
9 Videos
- DATA HANDLINGBOOK - MTG IIT JEE FOUNDATIONCHAPTER - DATA HANDLINGEXERCISE - Olympiad / Hots Corner
20 Videos
- CONGRUENCE OF TRIANGLES BOOK - MTG IIT JEE FOUNDATIONCHAPTER - CONGRUENCE OF TRIANGLES EXERCISE - Olympiad/HOTS Corner
10 Videos
- EXPONENTS AND POWERSBOOK - MTG IIT JEE FOUNDATIONCHAPTER - EXPONENTS AND POWERSEXERCISE - OLYMPIAD/HOTS CORNER
15 Videos
Similar Questions
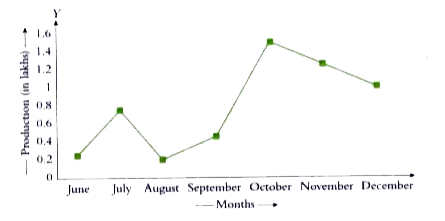
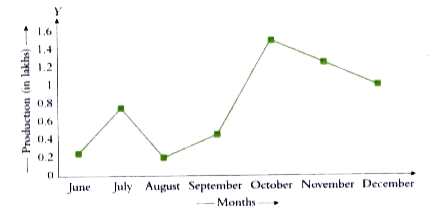
The line graph given below shows the production of a particular model of bike produced in different months. Read the line graph and answer the following questions:
In which month is the production maximum?
View SolutionRead the graph and answer the following questions
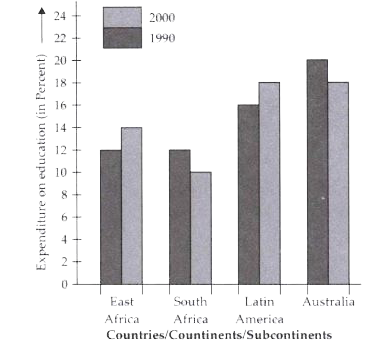
In which part the expenditure on education is maximum in 1990?
View Solution
Knowledge Check
The following graph gives Sales, Expenses and Capital of a company for a period of five years 1994 to 1998. Read the graph and answer the following questions.
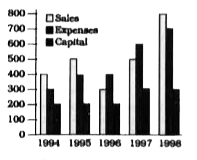
In which years was the ratio of sales tom capital the lowest ?A1998B1997C1996D1995Study the following graph carefully and answer the following questions -----
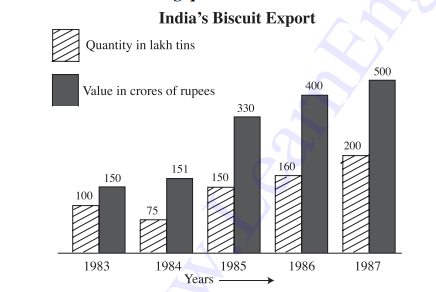
In which year the value per tins was minimum ?A1983B1984C1985D1986
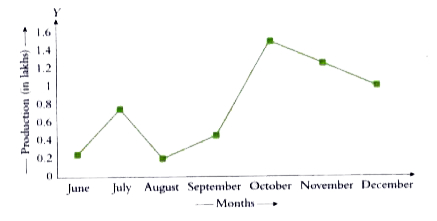
The line graph given below shows the production of a particular model of bike produced in different months. Read the line graph and answer the following questions:
In which month is the production least?
View SolutionRead the graph and answer the following questions
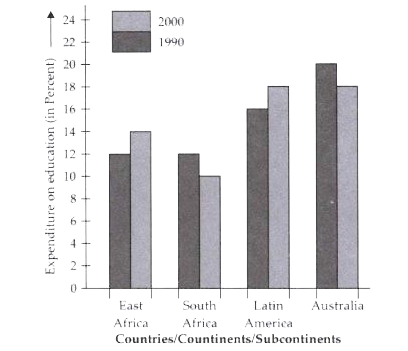
Give a suitable title to bar graph
View SolutionThe line graph given below shows the production of a particular model of bike produced in different months. Read the line graph and answer the following questions:
In which two successive months has the production increased?
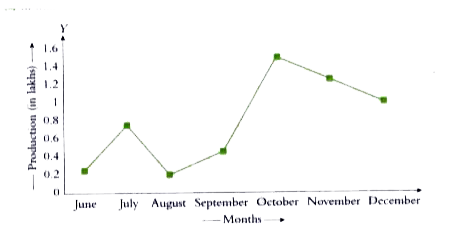
View SolutionThe line graph given below shows the production of a particular model of bike produced in different months. Read the line graph and answer the following questions:
In which two successive months has the production decreased?
View SolutionRead the graph and answer the following questions
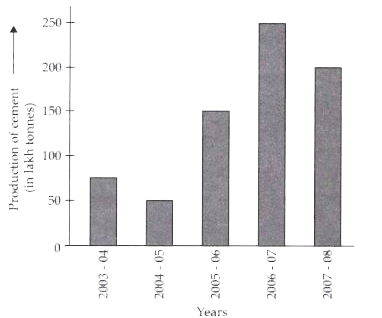
What information is conveyed by the bar graph
View SolutionRead the bar graph given below and answer the following questions.
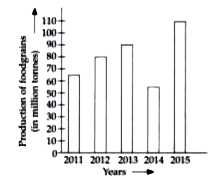
What is the ratio of the production of foodgrains in 2011 to that in 2014?
View Solution
