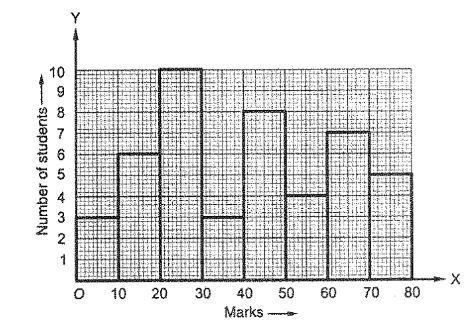
The marks obtained by 32 students of a class are given below. Prepare a frequency table with class intervals 31−40,41−50,….. etc.

The correct Answer is:(##NTNMATHIXC14E01005_A01##)
Step by step video & image solution for The marks obtained by 32 students of a class are given below. Prepare a frequency table with class intervals 31-40, 41-50, ….. etc. by Maths experts to help you in doubts & scoring excellent marks in Class 9 exams.
Updated on:21/07/2023Topper's Solved these Questions
- STATISTICSBook:NAGEEN PRAKASHAN ENGLISHChapter:STATISTICSExercise:EXERCISE 14B
Explore 13 Videos
- STATISTICSBook:NAGEEN PRAKASHAN ENGLISHChapter:STATISTICSExercise:Exercise 14c
Explore 20 Videos
- STATISTICSBook:NAGEEN PRAKASHAN ENGLISHChapter:STATISTICSExercise:Problems From NCERT/exemplar
Explore 22 Videos
- QUADRILATERALSBook:NAGEEN PRAKASHAN ENGLISHChapter:QUADRILATERALSExercise:Revision Exercise (long Answer Questions)
Explore 5 Videos
- SURFACE AREA AND VOLUMEBook:NAGEEN PRAKASHAN ENGLISHChapter:SURFACE AREA AND VOLUMEExercise:Revision Exercise (long Answer Questions)
Explore 10 Videos
Similar Questions
Write the comulative frequency of class interval 30-40

View SolutionGiven below are the marks obtained by 30 students of a class, Using the class intervals of equal class size in which one class interval is 30-40 (excluding 40), construct a frequency table.
427439484280353852813172655877827965473064563948606372504635
View SolutionThe table shows the marks obtained by 25 students in a class test. Find the mean of the marks obtained

View SolutionThe ages of 37 students in a class are given in the following table: Find the median
View SolutionThe marks obtained out of 50, by 102 students in a Physics test are given in the frequency table below: Marks (x) : 15 20 22 24 25 30 33 38 45 Frequency (f) : 5 8 11 20 23 18 13 3 1 Find the average number of marks.
View SolutionFollowing are the marks obtained by 30 students in a examination

Taking class intervals 0−10,10−20,…..40−50 construct a frequency table.
View SolutionA student draws a cumulative frequency curve for the marks obtained by 40 students of a class as shown below. Find the median marks obtained by the students of the class. (FIGURE)
View SolutionThe marks obtained by 30 students in a class assessment of 5 subjects is given below :

Calculate the mean, median and mode of the above distribution.
View SolutionThe following histogram depicts the marks obtained by 45 students of a class: Figure: Look at the histogram and answer the following questions: What is the class size? How many students obtained less than 10 marks? How many students obtained 30 or more marks but less than 40? What is the interval of highest marks and how many students are there in this interval? If passing marks are 30, what is the number of failures?

View SolutionThe heights of 50 students, measured to the nearest centimetres have been found to be as follows:

(i) Represent the data given above by a grouped frequency distribution table, taking class intervals as 160-165, 165-170 etc.
(ii) What can you conclude about their heights from the table ?
View Solution