The ages of 37 students in a class are given in the following table: Find the median
To find the median of the ages of 37 students, we will follow these steps:
Step 1: Organize the Data
Create a frequency table with the ages and their corresponding frequencies.
| Age | Frequency |
|-----|-----------|
| 11 | 2 |
| 12 | 4 |
| 13 | 6 |
| 14 | 10 |
| 15 | 8 |
| 16 | 7 |
Step 2: Calculate the Cumulative Frequency (CF)
Add the frequencies cumulatively to find the cumulative frequency.
- For age 11: CF = 2
- For age 12: CF = 2 + 4 = 6
- For age 13: CF = 6 + 6 = 12
- For age 14: CF = 12 + 10 = 22
- For age 15: CF = 22 + 8 = 30
- For age 16: CF = 30 + 7 = 37
So the cumulative frequency table looks like this:
| Age | Frequency | Cumulative Frequency (CF) |
|-----|-----------|---------------------------|
| 11 | 2 | 2 |
| 12 | 4 | 6 |
| 13 | 6 | 12 |
| 14 | 10 | 22 |
| 15 | 8 | 30 |
| 16 | 7 | 37 |
Step 3: Determine the Median Position
Since there are 37 students (n = 37), we calculate the position of the median using the formula:
Median Position=n+12=37+12=382=19
Step 4: Locate the Median in the Cumulative Frequency Table
Now, we need to find the cumulative frequency that is greater than or equal to 19. Looking at our CF column:
- The CF for age 13 is 12 (not enough)
- The CF for age 14 is 22 (this is greater than 19)
Thus, the age corresponding to the cumulative frequency of 22 is 14.
Step 5: Conclusion
The median age of the students is 14.
Create a frequency table with the ages and their corresponding frequencies.
|-----|-----------|
| 11 | 2 |
| 12 | 4 |
| 13 | 6 |
| 14 | 10 |
| 15 | 8 |
| 16 | 7 |
Add the frequencies cumulatively to find the cumulative frequency.
- For age 12: CF = 2 + 4 = 6
- For age 13: CF = 6 + 6 = 12
- For age 14: CF = 12 + 10 = 22
- For age 15: CF = 22 + 8 = 30
- For age 16: CF = 30 + 7 = 37
|-----|-----------|---------------------------|
| 11 | 2 | 2 |
| 12 | 4 | 6 |
| 13 | 6 | 12 |
| 14 | 10 | 22 |
| 15 | 8 | 30 |
| 16 | 7 | 37 |
Since there are 37 students (n = 37), we calculate the position of the median using the formula:
Now, we need to find the cumulative frequency that is greater than or equal to 19. Looking at our CF column:
- The CF for age 14 is 22 (this is greater than 19)
The median age of the students is 14.
Topper's Solved these Questions
- MEASURES OF CENTRAL TENDENCY (MEAN, MEDIAN, QUARTILES AND MODE)BOOK - ICSECHAPTER - MEASURES OF CENTRAL TENDENCY (MEAN, MEDIAN, QUARTILES AND MODE)EXERCISE - EXERCISE 24 (D)
8 Videos
- MEASURES OF CENTRAL TENDENCY (MEAN, MEDIAN, QUARTILES AND MODE)BOOK - ICSECHAPTER - MEASURES OF CENTRAL TENDENCY (MEAN, MEDIAN, QUARTILES AND MODE)EXERCISE - EXERCISE 24 (E)
23 Videos
- MEASURES OF CENTRAL TENDENCY (MEAN, MEDIAN, QUARTILES AND MODE)BOOK - ICSECHAPTER - MEASURES OF CENTRAL TENDENCY (MEAN, MEDIAN, QUARTILES AND MODE)EXERCISE - EXERCISE 24 (B)
10 Videos
- MATRICESBOOK - ICSECHAPTER - MATRICESEXERCISE - Exercise 9D
25 Videos
- MIXED PRACTICE BOOK - ICSECHAPTER - MIXED PRACTICE EXERCISE - SET B
52 Videos
Similar Questions
The age of 40 student of a class is given in the following table. Find their mean short cut method:

View SolutionThe weights of 25 students of a class are given in the following table:

Using short-cut method, find the mean weight.
View SolutionThe makes obtained by 30 students are given in the following table. Find their mean by step deviation method :

View SolutionThe marks (out of 10) obtained by 35 students of a class are given in the following table :
Marks obtained71102864593Number of students7020196451
Find the mean and the median.
Using empirical formula, calculate its mode.
View SolutionThe ages of 40 students are given in the following table: Age(in yrs) 12 13 14 15 16 17 18 Frequency 2 4 6 9 8 7 4 Find the arithmetic mean.
View SolutionThe weights of 60 boys are given in the following distribution table:Find
(i) Median (ii) Lower quartile (iii) Upper quartile (iv) Inter quartile range
View Solution
The test grades of the 26 students in a math class are shown in the chart above. What is the median test grade for the clsss?
View SolutionFind the median from the following table :

View SolutionFind the median from the following table :

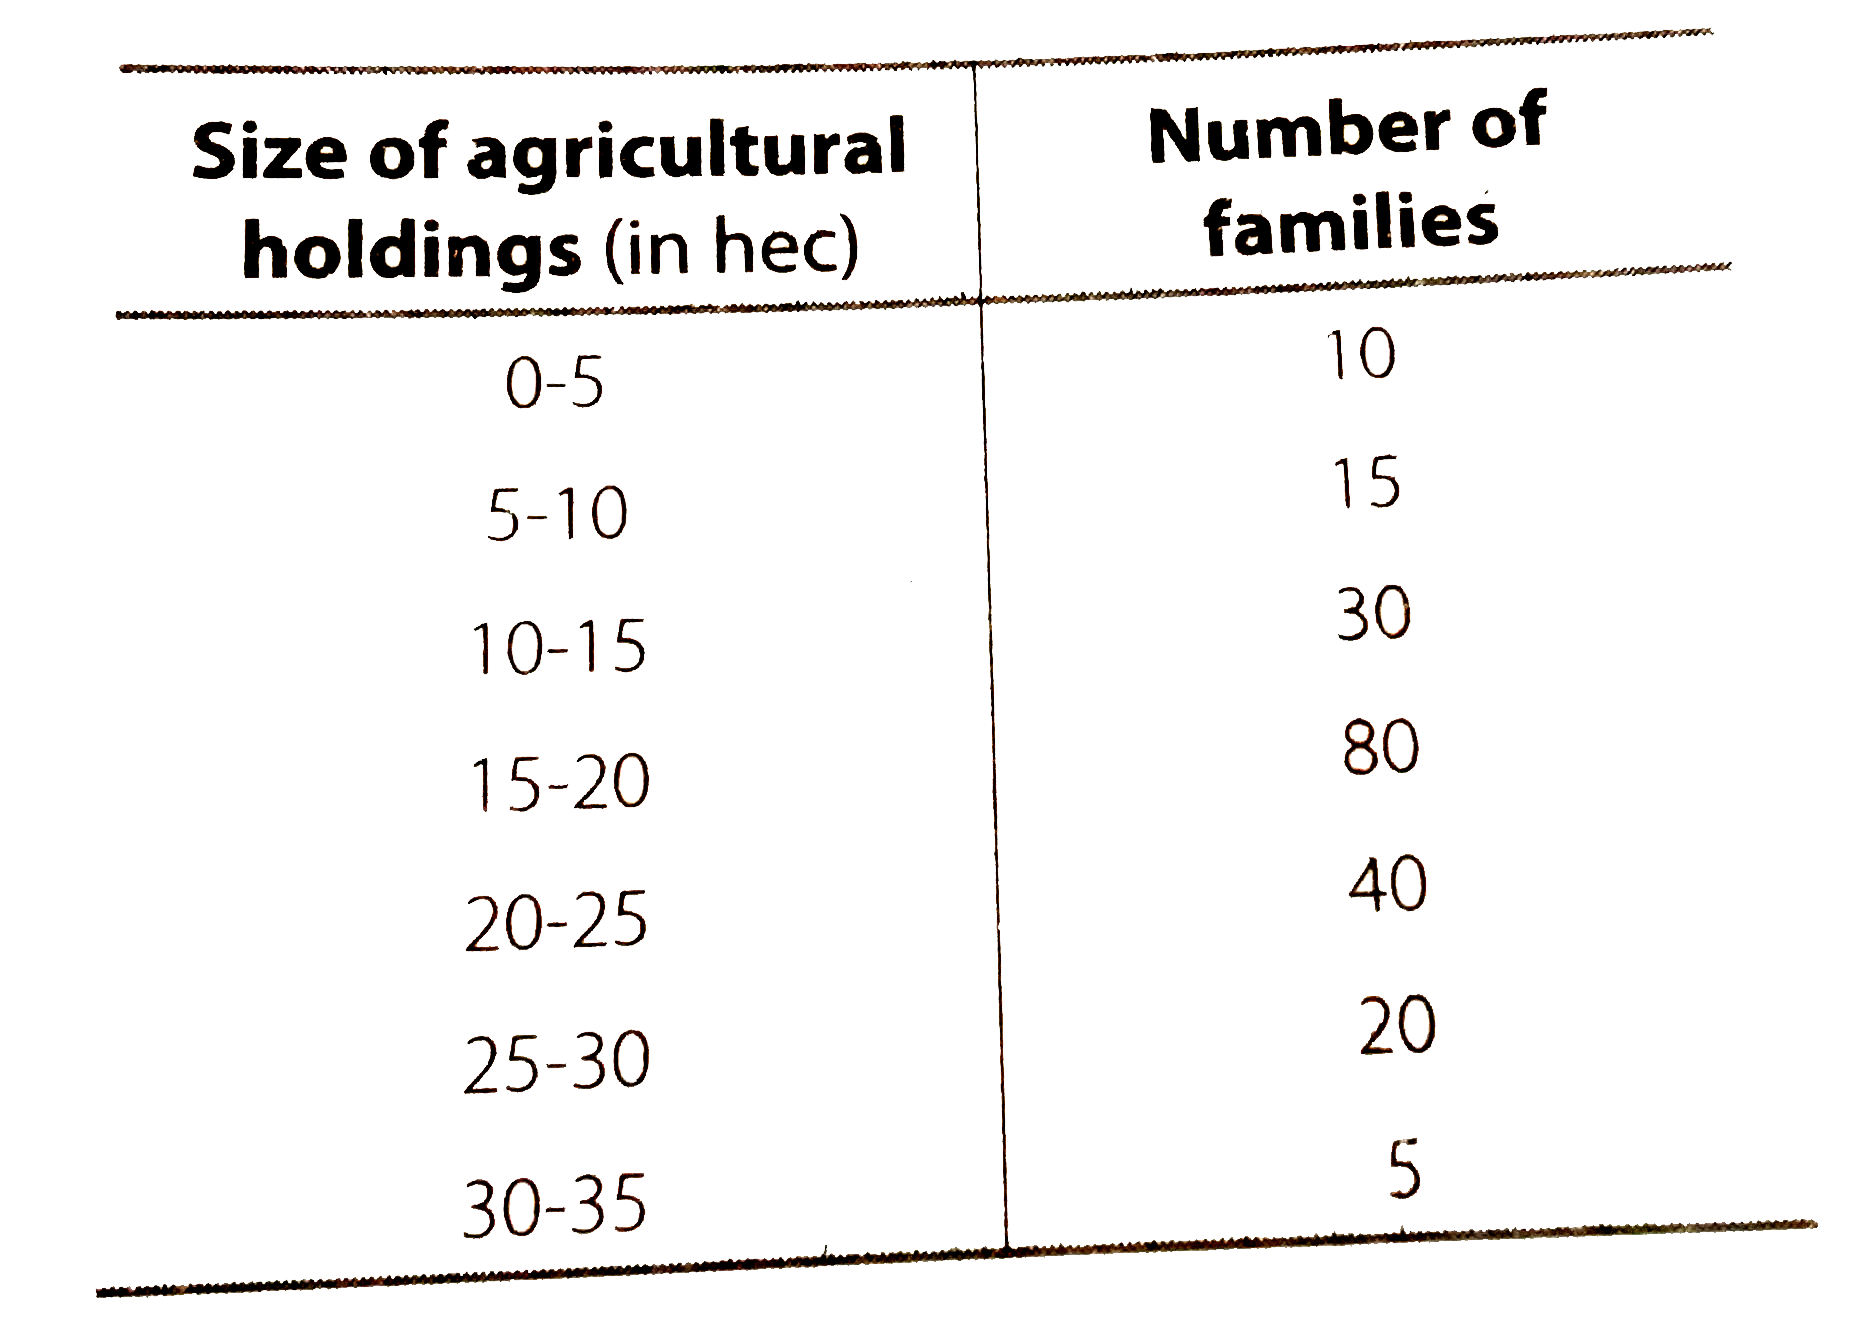
View SolutionSize of agricultural holding in a survey of 200 families is given in the following table.

Compute median and mode size of the holdings.
View Solution
