The median can graphically be found from
ogive
histogram
frequency curve
none of these
The correct Answer is:A
Step by step video & image solution for The median can graphically be found from by Maths experts to help you in doubts & scoring excellent marks in Class 12 exams.
Updated on:21/07/2023Topper's Solved these Questions
- MEASURES OF CENTRAL TENDENCYBook:OBJECTIVE RD SHARMA ENGLISHChapter:MEASURES OF CENTRAL TENDENCYExercise:Chapter Test
Explore 21 Videos
- MEASURES OF CENTRAL TENDENCYBook:OBJECTIVE RD SHARMA ENGLISHChapter:MEASURES OF CENTRAL TENDENCYExercise:Section I - Solved Mcqs
Explore 24 Videos
- MAXIMA AND MINIMA Book:OBJECTIVE RD SHARMA ENGLISHChapter:MAXIMA AND MINIMA Exercise:Chapter Test
Explore 29 Videos
- MISCELLANEOUS EQUATIONS AND INEQUATIONS Book:OBJECTIVE RD SHARMA ENGLISHChapter:MISCELLANEOUS EQUATIONS AND INEQUATIONS Exercise:Chapter Test
Explore 29 Videos
Similar Questions
Solve y<2graphically.
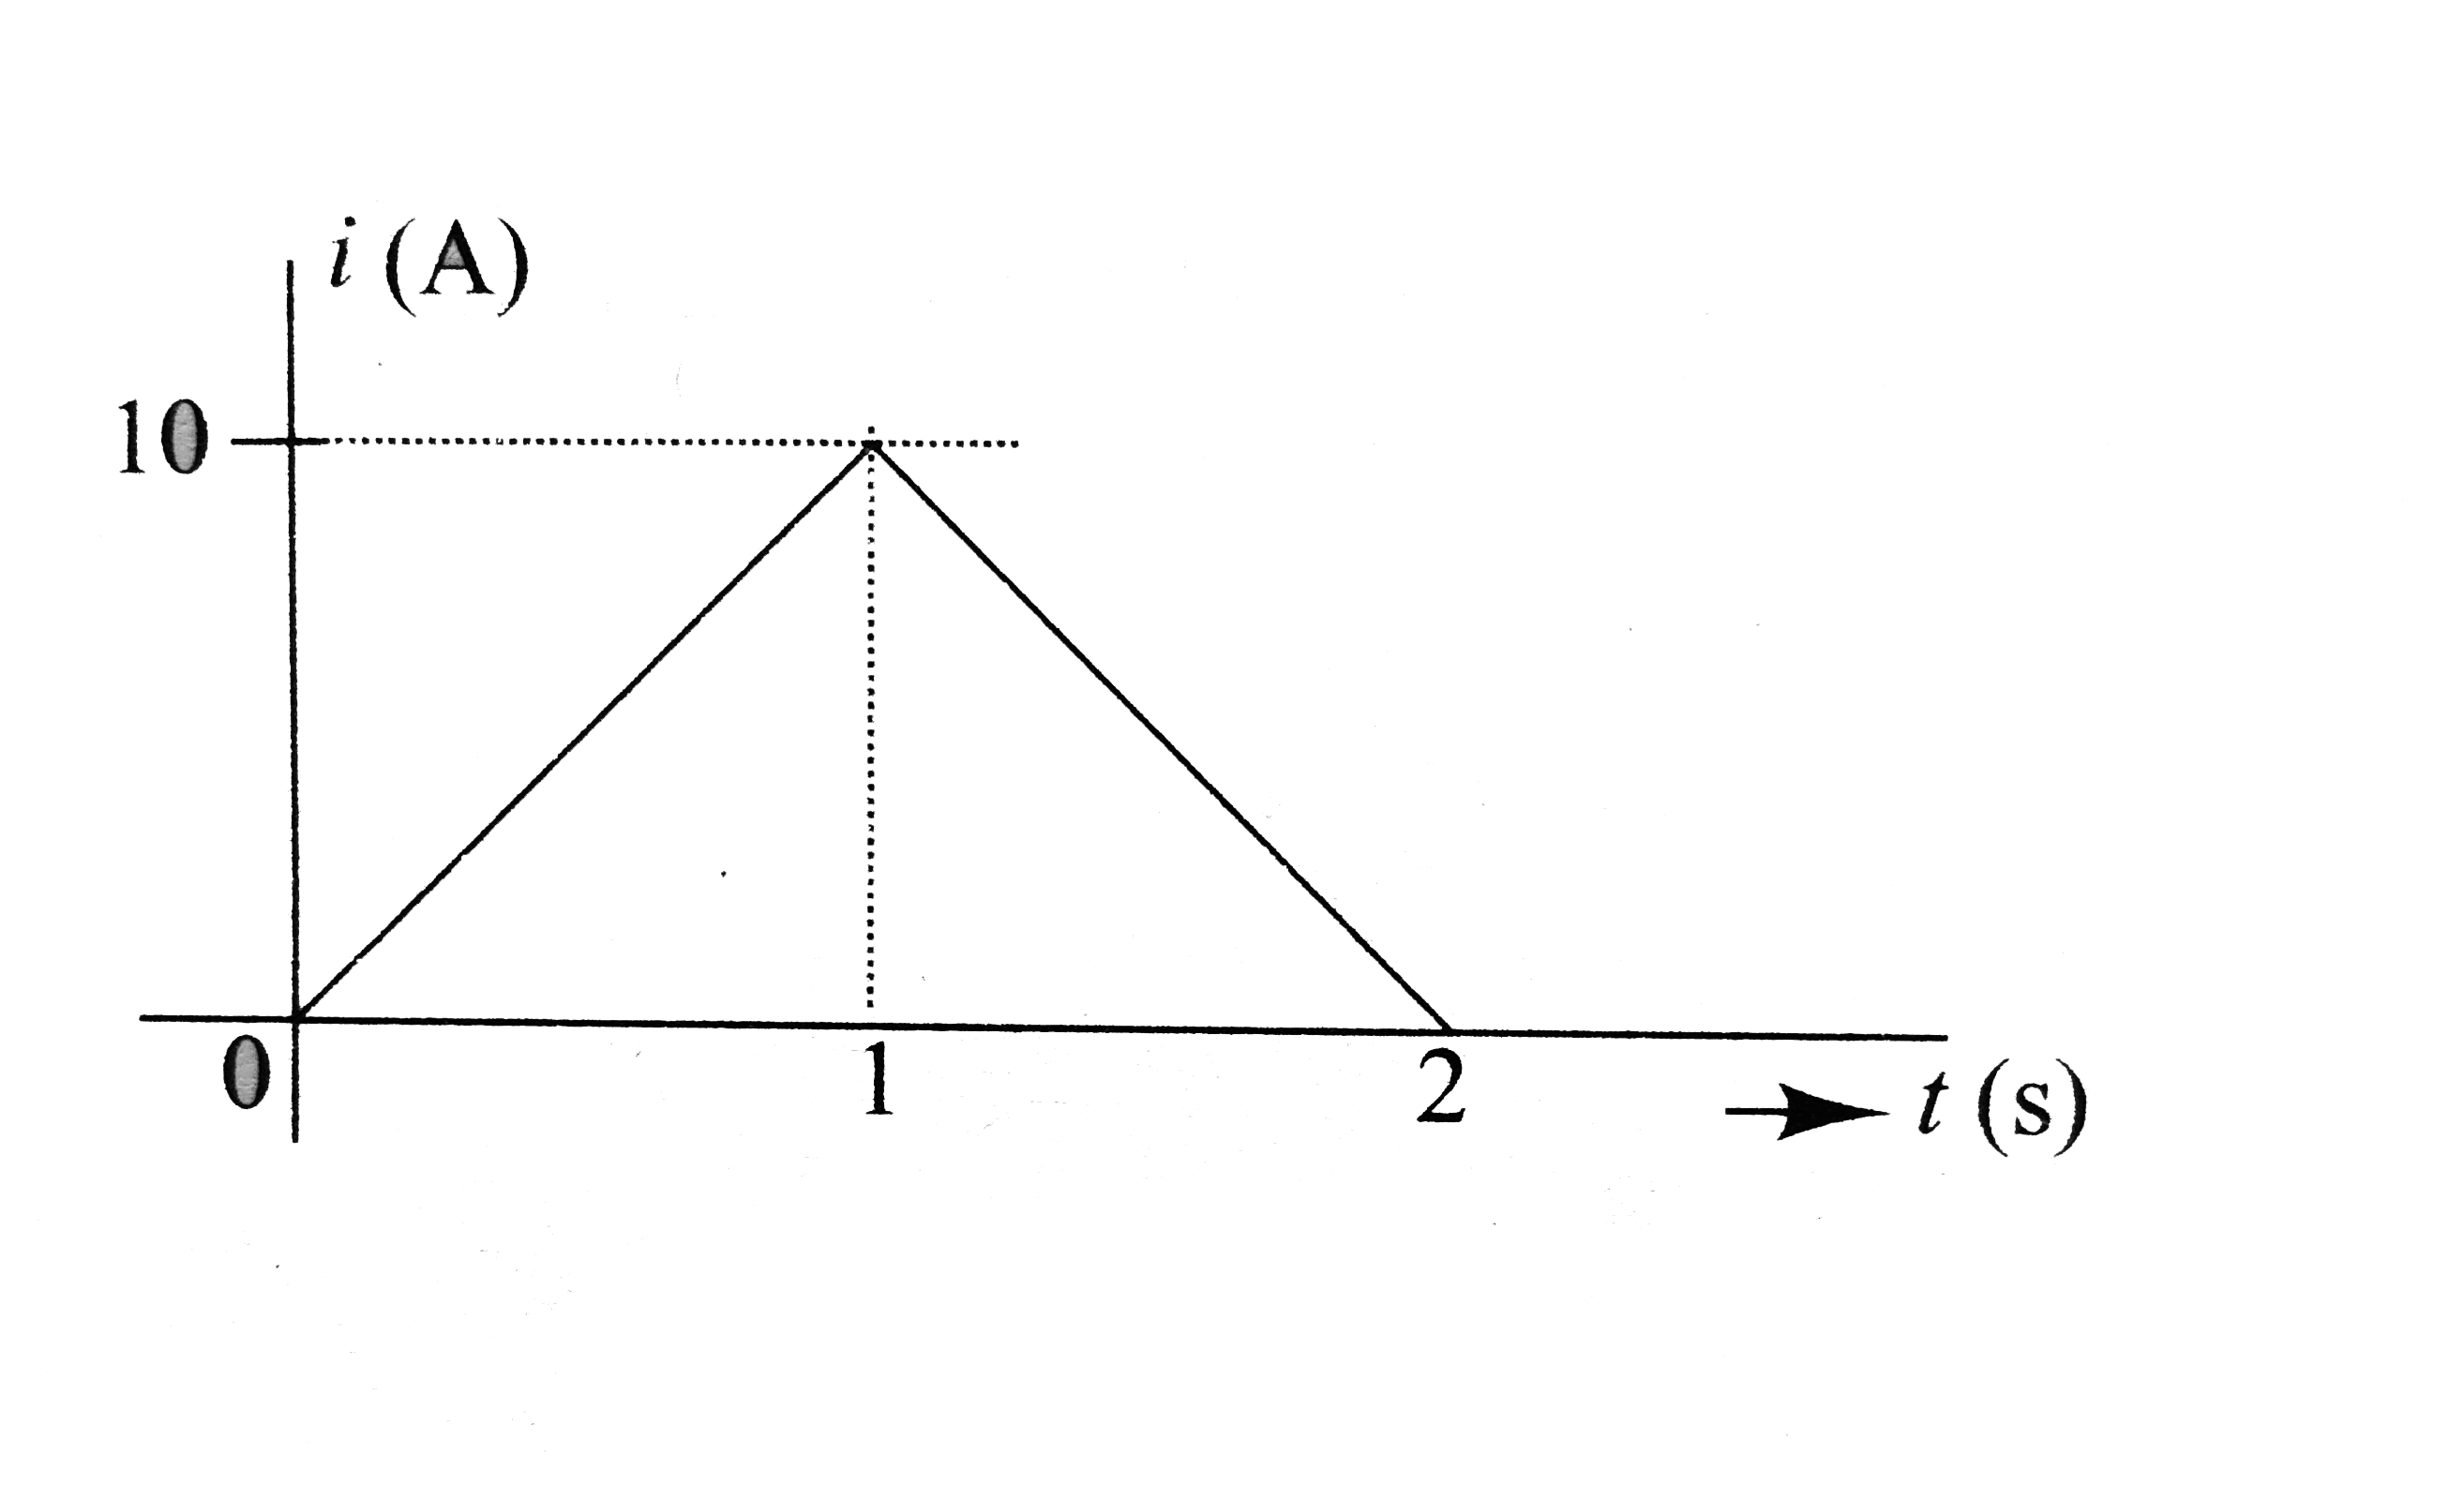
View SolutionFind the avarage value of current (in A) shown graphically in fig. From t=0→t=2s.
 .
.
View SolutionFind the avarage value of current (in A) shown graphically in fig. From t=0→t=2s.
 .
.
View SolutionThe acceleration of a moving body can be found from
View SolutionThe acceleration of a moving body can be found from
View SolutionHow can you graphically find the activation energy of the reaction from the above expression?
View SolutionThe mode of a frequency distribution can be determined graphically from (a) Histogram (b) Frequency polygon (c) Ogive (d) Frequency curve
View SolutionAssertion : The rate at which a population can be expected to grow in the future can be assessed graphically by means ofa population pyrmid.
Reason : A triangular population pyramid is characteristics of a country whose population is stable, neither growing nor shrinking.
View SolutionThe median of a triangle divides it into two
View SolutionIf eight distinct points can be found on the curve |x|+|y|=1 such that from eachpoint two mutually perpendicular tangents can be drawn to the circle x2+y2=a2, then find the range of a.
View Solution