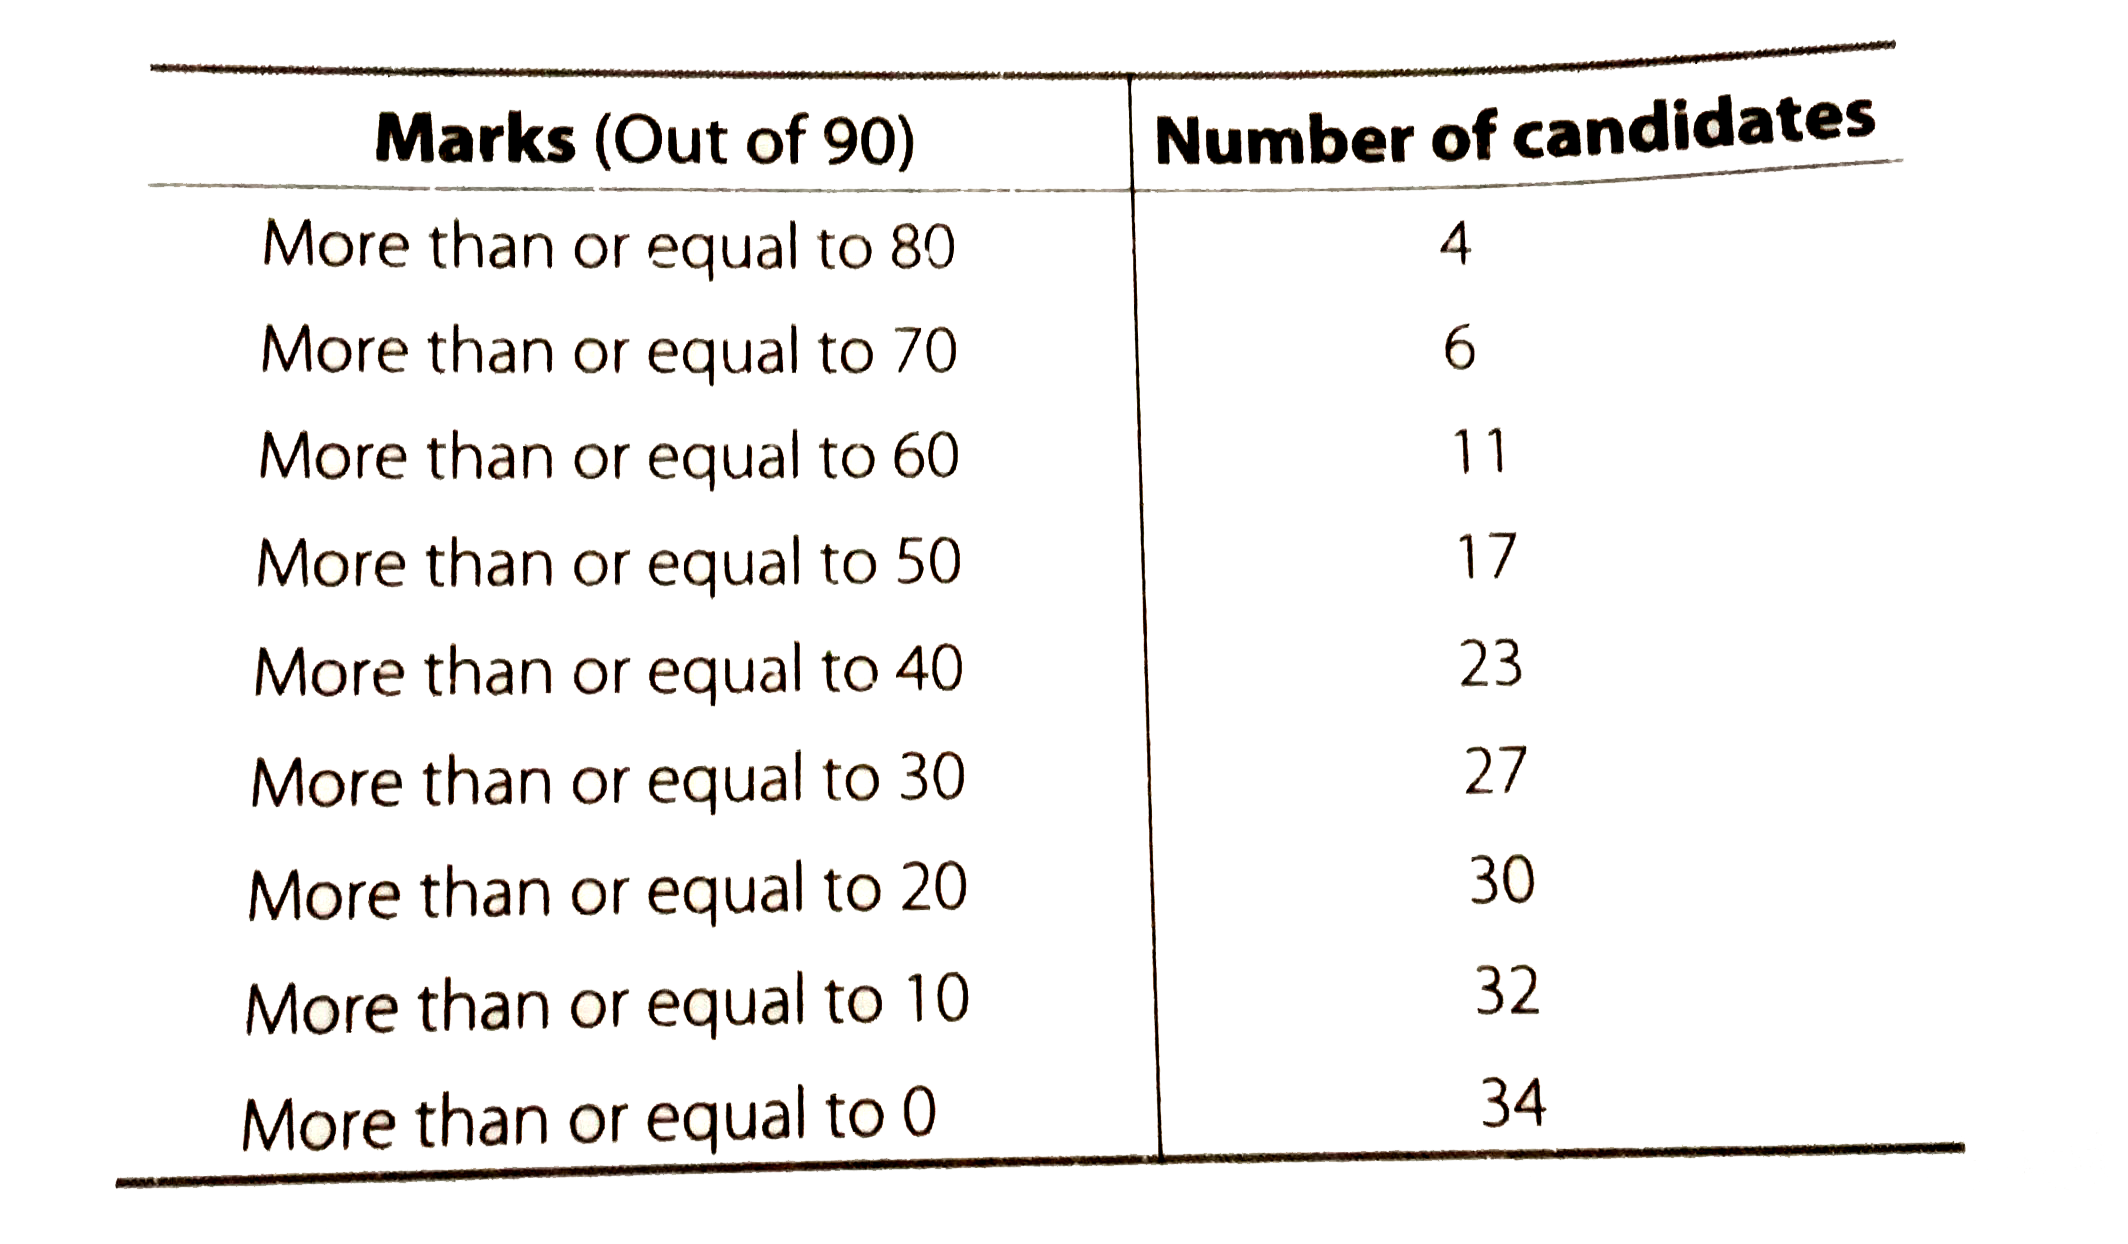
The mode of a frequency distribution can be determined graphically from (a) Histogram (b) Frequency polygon (c) Ogive (d) Frequency curve
Step by step video & image solution for The mode of a frequency distribution can be determined graphically from (a) Histogram (b) Frequency polygon (c) Ogive (d) Frequency curve by Maths experts to help you in doubts & scoring excellent marks in Class 10 exams.
Updated on:21/07/2023Topper's Solved these Questions
Similar Questions
Cumulative Frequency Distribution
View SolutionThe mode for the following frequency distribution :

View SolutionThe median of a given frequency distribution is found graphically with the help of (a) Histogram (b) Frequency curve (c) Frequency polygon (d) Ogive
View SolutionFrom the frequency distribution table from the following data

View SolutionFind the mode of the following frequency distribution

View SolutionFind the mode of the following frequency distribution :

View SolutionQuartile deviation for a frequency distribution is
View SolutionFind the mean of the following frequency distribution by direct method.

View SolutionFind the mean for the following frequency distribution :

View SolutionCompute the mode for the following frequency distribution :

View Solution
