The monthly family expenditure (in percentage) on different items are as follows:
∣∣∣FoodRentClothTransportEducationOthers 38 19 18 − 9 6∣∣∣
If the total monthly expenditure is Rs 9000, then what is the expenditure on transport?
Rs 180
Rs 1000
Rs 900
Rs 360
The correct Answer is:C
Requried expenditure =9000×10100
= Rs 900.
Topper's Solved these Questions
- BOOK - NDA PREVIOUS YEARSCHAPTER - SETS, RELATIONS, FUNCTIONS AND NUMBER SYSTEM EXERCISE - MCQ271videos
SETS, RELATIONS, FUNCTIONS AND NUMBER SYSTEM
- BOOK - NDA PREVIOUS YEARSCHAPTER - TRIGONOMETRY - RATIO & IDENTITY , TRIGONOMETRIC EQUATIONSEXERCISE - MCQ238videos
TRIGONOMETRY - RATIO & IDENTITY , TRIGONOMETRIC EQUATIONS
Similar Questions
The monthly family expenditure (in %) on n different items are follows

if the total monthly expenditure is Rs 9000, then what is the expenditure on transport.
(a)Rs180
(b)Rs1000
(c)Rs900
(d)Rs360View Solutionin the given pie chart monthly expenditure of a family has been shown. If the total monthly expenditure is Rs 10800, then find the expenditure on house rent
View Solution
Knowledge Check
- Question 1 - Select One
A saves 20% of his monthly salary. If his monthly expenditure is X 6000, then his monthly savings is
A1500B1, 800C1200D4800 - Question 2 - Select One
The given pie chart shows the distribution of expenditure of a company (in percentage) . The total expenditure of the company is Rs. 136000.

A new expenditure of transportion is added and to meet this expenditure, all others expenditures are reduced. If the central angle formed by the expenditure incurred on Transportation is 72∘, then how much amount (in Rs) all other expenses are reduced?A25200B23000C27200D20400
The monthly expenditure of a family on different items is given in the following table. Calculate the related central angles.
View SolutionFollowing table shows the monthly expenditure of Imran’s familyon various items.
View SolutionThe following table shows the household expenditure of family on different items. Draw a pie chart to represent the given data.
ItemRentFoodClotingEducationOthersExpenditure25%30%10%15%20%View SolutionThe following table shows the monthly expenditure of different families on different items :

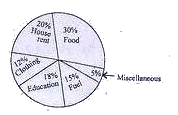
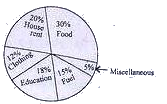
Represent the data in the form of a sub-divided bar diagram.View SolutionThe following pie-chart shows the monthly expenditure of a family on food, house rent clothing, education, fuel and miscellaneous Study the pie-chart

If the expenditure on fuel is Rs 3000, then the total expenditure excluding expenditure on house rent and education isView SolutionThe following pie-chart shows the monthly expenditure of a family on food, house rent clothing, education, fuel and miscellaneous Study the pie-chart

If the expenditure for food is 9000, then the expenditure for education isView Solution

