The number of stools in five rooms of a school are gien below:

Step by step video & image solution for The number of stools in five rooms of a school are gien below: by Maths experts to help you in doubts & scoring excellent marks in Class 6 exams.
Topper's Solved these Questions
Similar Questions
In a school, there are five sections of Class VI. The number of students in each section is given below:

Represent the above data using a bar graph.View SolutionIn a school, there are five sections of class IX. The number of students in each section is given below. Construct a bar graph representing this data: Section: A B C D E No. of Students 40 48 52 45 30
View Solution
Knowledge Check
- Question 1 - Select One
The pie-chart given below represents the number of students using different transport to a school in which total number of students is 2160.
Answer the questions based on the following diagram.
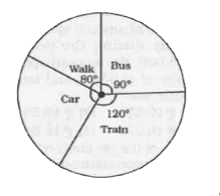
The number of students who come to school by car isA70B290C420D480 - Question 2 - Select One
The pie-chart given below represents the number of students using different transport to a school in which total number of students is 2160.
Answer the questions based on the following diagram.
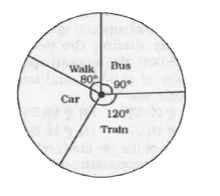
The ratio of the number of students who come to school by car to the number of students who come to school by bus isA21:24B21:27C36:27D36:21 - Question 3 - Select One
The pie-chart shows the percentage-wise distribution of the number of students in five different schools P,Q,R,S and T .
The total number of students in all five schools together is 10,500 .
Study the pie -chart and answer the question .
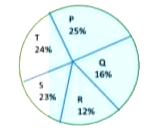
The difference between the central angles corresponding to schools T and R is :A42.8∘B44∘C43.2∘D34.5∘
The pie-chart given below represents the number of students using different transport to a school in which total number of students is 2160.
Answer the questions based on the following diagram.
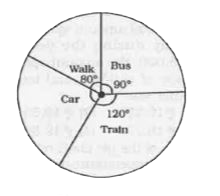
The number of students coming to school by bus exceeds the number of students coming to school walking byView SolutionIn a school, there are five sections of class VII. The number of students in each section is given below. Construct a bar graph representing this data: Section, A, B, C, D, E No. of Students, 40, 48, 52, 45, 30
View SolutionThe following pie-chart shows the percentage-wise distribution of the number of students in five different schools P, Q, R, S and T. The total number of students in all five schools together is 8400.
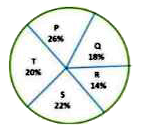
Find the average number of students in schools R and S together.View SolutionThe ratio of the number oif boys to that of girls in a school is 9:11. If the number of girls in the school is 2035, find:
a. number of boys is school.
b. number of students in school.View SolutionThe pie-chart shows the percentage-wise distribution of the number of students in five different schools P,Q,R,S and T .
The total number of students in all five schools together is 10,500 .
Study the pie -chart and answer the question .
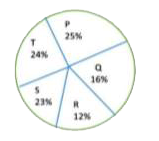
The number of students in school R is what per cent of the total number of students in schools Q and T together ?View Solution
