The percentage of marks obtained, in different subjects by Ashok Sharma (in an examination) are given below. Draw a bar graph to represent it.

The correct Answer is:(##SELRKBICSEMATVIIIC22E02003_A01##)
Step by step video, text & image solution for The percentage of marks obtained, in different subjects by Ashok Sharma (in an examination) are given below. Draw a bar graph to represent it. by Maths experts to help you in doubts & scoring excellent marks in Class 8 exams.
Updated on:21/07/2023Topper's Solved these Questions
- DATA HANDLING BOOK - ICSECHAPTER - DATA HANDLING EXERCISE - EXERCISE 22 (A) ( Fill in the blanks : )
5 Videos
- CUBES AND CUBE - ROOTS BOOK - ICSECHAPTER - CUBES AND CUBE - ROOTS EXERCISE - EXERCISE 4(B)
39 Videos
- DIRECT AND INVERSE VARIATIONSBOOK - ICSECHAPTER - DIRECT AND INVERSE VARIATIONSEXERCISE - EXERCISE 10 (E)
19 Videos
Similar Questions
The approximate speeds of some objects are given below. Draw a bar graph to represent them.

View SolutionThe approximate speeds of some objects are given below. Draw a bar graph to represent them:

View SolutionThe expenditure of a family of different heads in a month is given below

Draw a bar graph to represent the data above.
View SolutionHundred students from a certain locality use different modes of travelling to school as given below. Draw a bar graph.

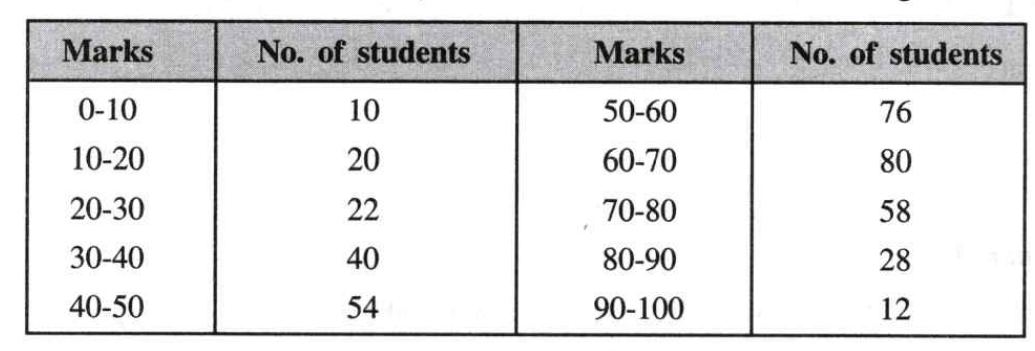
View SolutionThe marks obtained (out of 100) by 400 students in an examination are given below:

Using a graph paper, draw an ogive for the above distribution. Use ogive to estimate:
the number of students who did not pass if the pass percentage was 35.
View SolutionThe marks obtained (out of 100) by 400 students in an examination are given below:

Using a graph paper, draw an ogive for the above distribution. Use ogive to estimate the following: estimate the number of students who obtained more than 80% marks in the examination.
View SolutionThe marks obtained (out of 100) by 400 students in an examination are given below:

Using a graph paper, draw an ogive for the above distribution. Use ogive to estimate the following: estimate the median.
View SolutionThe following data on the number of girls (to the nearest ten) per thousand boys in different sections of Indian society is given below. Draw bar graph for the the data given below.
View SolutionThe percentage of marks obtained by a student in the monthly unit tests are given below.Based on this data, find the probability that the student gets more than 70% marks in a unit test.
View SolutionThe marks obtained (out of 100) by a class of 80 students are given below:

Construct a histogram to represent the data above
View Solution
