The prices of different lengths of ladder (in m ) is shown in the following table:

Represent this information by a graph.
Step by step video & image solution for The prices of different lengths of ladder (in m ) is shown in the following table: Represent this information by a graph. by Maths experts to help you in doubts & scoring excellent marks in Class 8 exams.
Updated on:21/07/2023Topper's Solved these Questions
- INTRODUCTION TO GRAPHS Book:MTG IIT JEE FOUNDATIONChapter:INTRODUCTION TO GRAPHS Exercise:EXERCISE (SUBJECTIVE PROBLEMS) (VERY SHORT ANSWER TYPE)
Explore 1 Video
- INTRODUCTION TO GRAPHS Book:MTG IIT JEE FOUNDATIONChapter:INTRODUCTION TO GRAPHS Exercise:EXERCISE (SUBJECTIVE PROBLEMS) (SHORT ANSWER TYPE)
Explore 2 Videos
- INTRODUCTION TO GRAPHS Book:MTG IIT JEE FOUNDATIONChapter:INTRODUCTION TO GRAPHS Exercise:EXERCISE (Assertion & Reason Type)
Explore 8 Videos
- FOOTSTEPS TOWARDS JEE MAINBook:MTG IIT JEE FOUNDATIONChapter:FOOTSTEPS TOWARDS JEE MAINExercise:Section B (Numerical Value Type Questions)
Explore 9 Videos
- LINEAR EQUATIONS IN ONE VARIABLEBook:MTG IIT JEE FOUNDATIONChapter:LINEAR EQUATIONS IN ONE VARIABLEExercise:Olympiad/HOTS Corner
Explore 15 Videos
Similar Questions
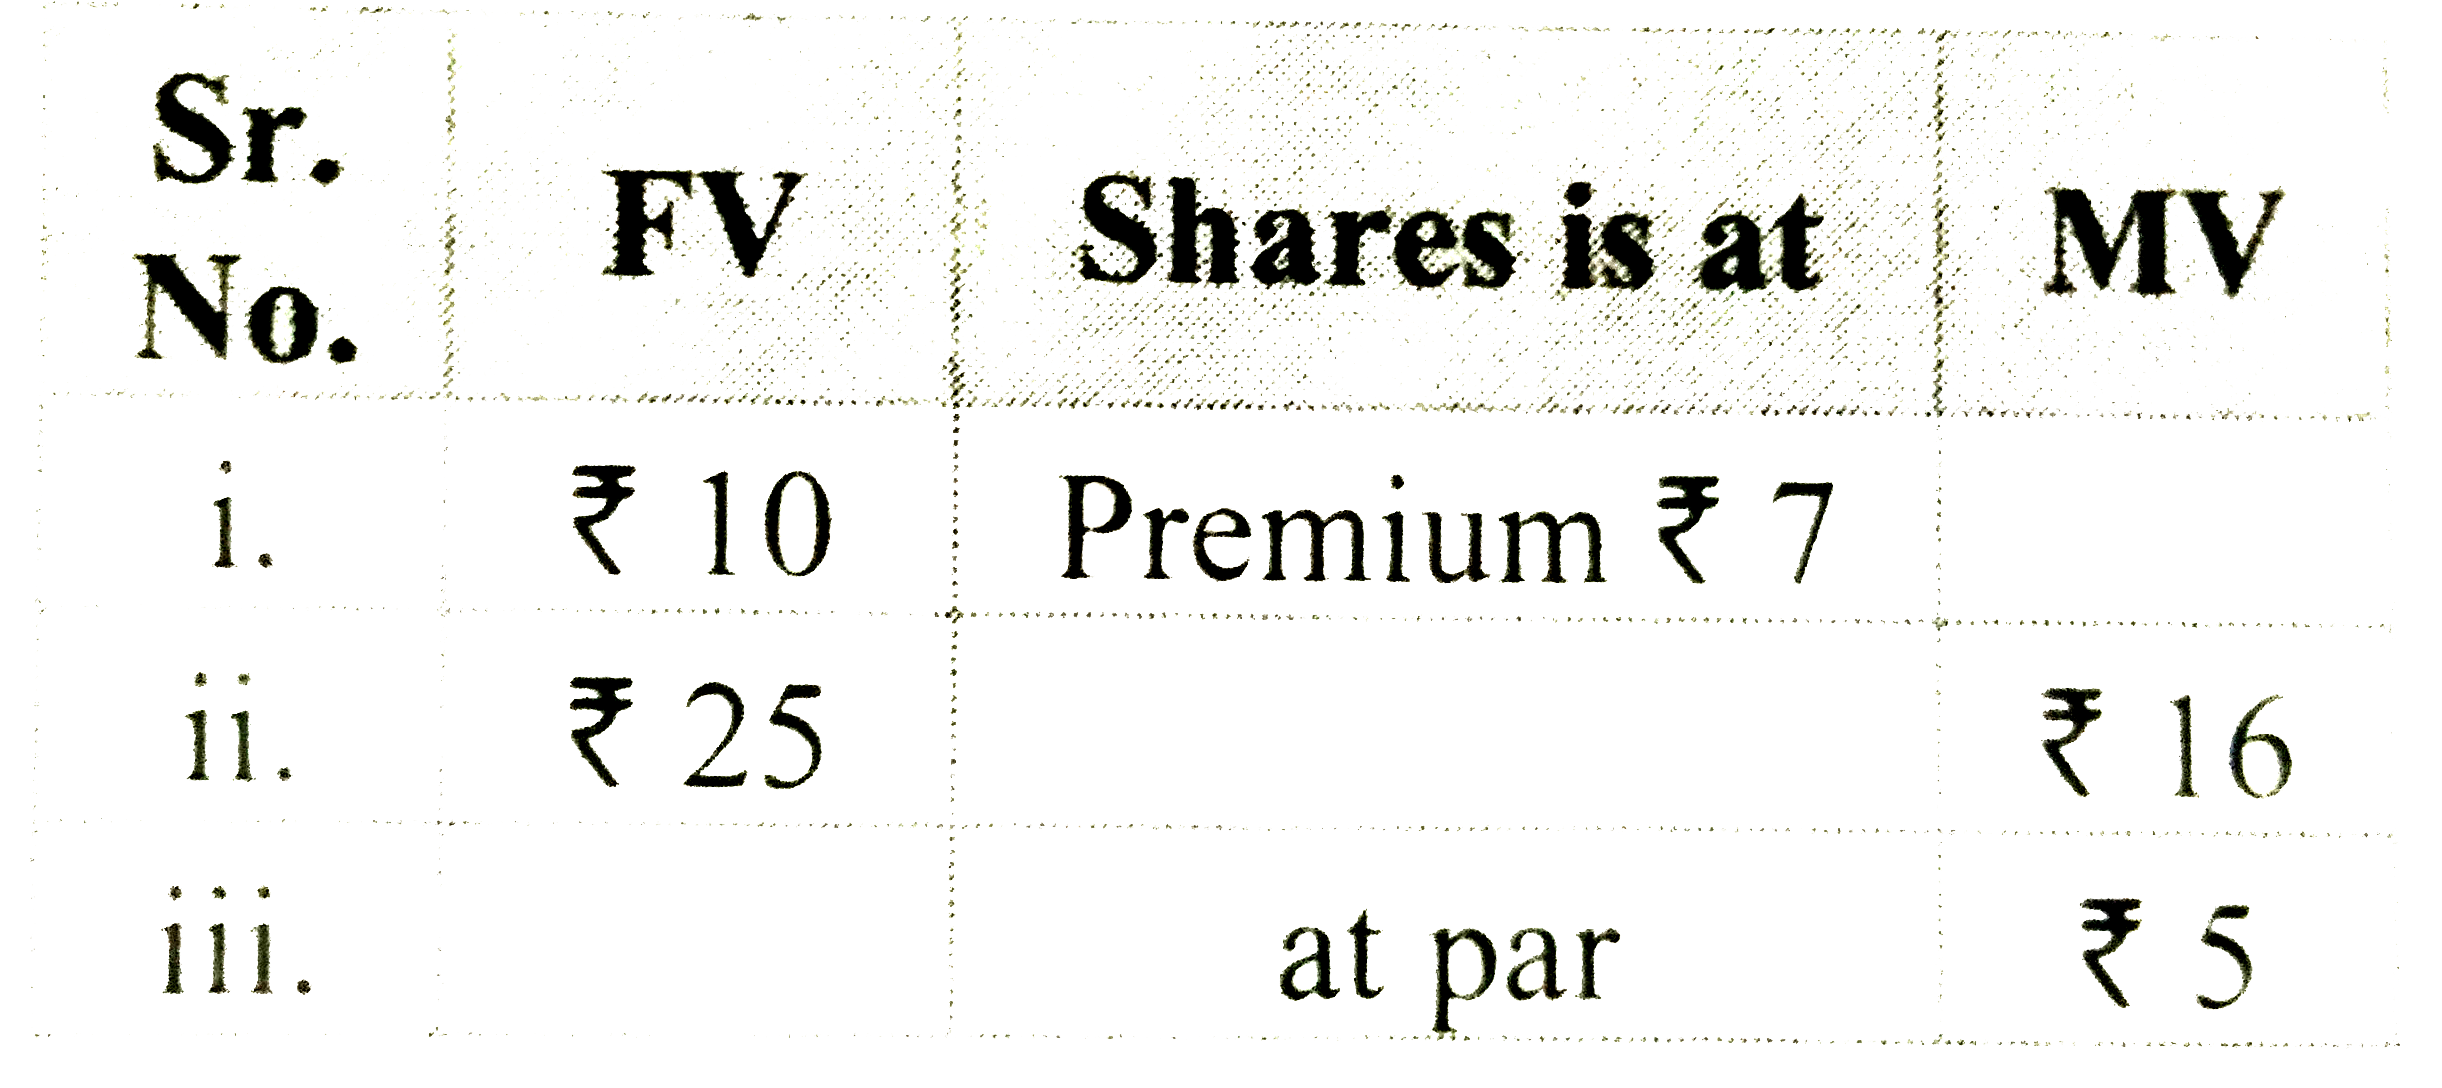
Complete the following table using given information
View SolutionThe prices of different articles and demand for them is shown in the following frequency distribution table. Find the median of the prices.

View SolutionThe prices of different articles and demand for them is shown in the following frequency distribution table. Find the median of the prices.

View SolutionDraw the line graph for the following table:

View SolutionThe following data on the number of girls (to the nearest ten) per thousand boys in different sections of Indian society is given below
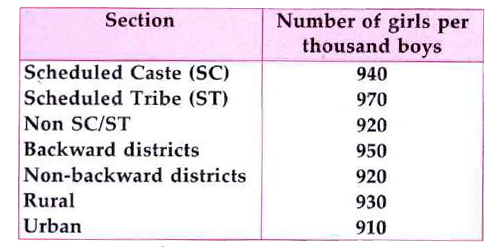
Represent the information above by a bar graph.
View SolutionTotal number of students of a school in different years is shown in the following table
View SolutionThe number of ATMs of different banks in a city is shown below:
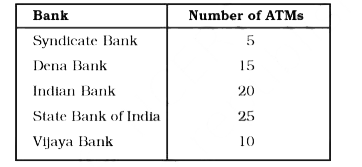
Draw a bar graph to represent the above information by choosing the scale of your choice.
View SolutionThe percentage of expenditure on different heads in a budget of a state is as shown below :

Draw a pie diagram to represent the information .
View SolutionTotal number of students of a school in different years is shown in the following table.
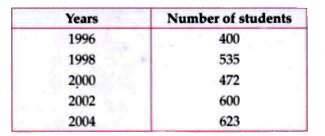
Prepare another pictograph of students using any other symbol each representing 50 students. Which pictograph do you find more informative ?
View SolutionIn a botanical garden, the number of different types of plants are found as follows:
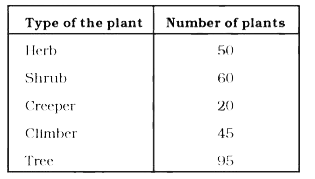
Draw a bar graph to represent the above information and answer the following question:
Which type of plant is maximum in number in the garden?
View Solution
