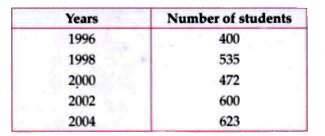
Total number of students of a school in different years is shown in the following table.

Prepare another pictograph of students using any other symbol each representing 50 students. Which pictograph do you find more informative ?
Step by step video & image solution for Total number of students of a school in different years is shown in the following table. Prepare another pictograph of students using any other symbol each representing 50 students. Which pictograph do you find more informative ? by Maths experts to help you in doubts & scoring excellent marks in Class 6 exams.
Topper's Solved these Questions
- BOOK - MTG IIT JEE FOUNDATIONCHAPTER - DATA HANDLING EXERCISE - NCERT Section (Exercise 9.3)11videos
DATA HANDLING
- BOOK - MTG IIT JEE FOUNDATIONCHAPTER - DATA HANDLING EXERCISE - NCERT Section (Exercise 9.4)4videos
DATA HANDLING
- BOOK - MTG IIT JEE FOUNDATIONCHAPTER - DATA HANDLING EXERCISE - NCERT Section (Exercise 9.1)22videos
DATA HANDLING
- BOOK - MTG IIT JEE FOUNDATIONCHAPTER - BASIC GEOMETRICAL IDEASEXERCISE - OLYMPIAD/HOTS CORNER10videos
BASIC GEOMETRICAL IDEAS
- BOOK - MTG IIT JEE FOUNDATIONCHAPTER - DECIMALSEXERCISE - OLYMPIAD/HOTS CORNER20videos
DECIMALS
Similar Questions
Total number of students of a school in different years is shown in the following table: Year, No. of Students 1996 1998 2000 2002 2004, 400 550 450 600 650 Represent the above data by a pictograph. Prepare a pictograph of students using one symbol an icon of a student to represent 100 students and answer the following questions: How many symbols represent total number of students in the year 2002? How many symbols represent total number of students in the year 1998? Prepare another pictograph of students using any other symbol each representing 50 students. Which pictograph do you find more informative?
View SolutionTotal number of animals in five villages are as follows: Village, Number of animals A B C D E, 80 120 90 40 60 Prepare a pictograph of these animals using one symbol to represent 10 animals.
View Solution
Knowledge Check
- Question 1 - Select One
The number of students enrolled in different streams in a college is shown in the following table.

The ratio of the total number of boys to that of girls in the college is:A1:1B23:27C13:12D27:23 - Question 2 - Select One
Study the following table and answer the questions.

The total number of students scoring 50% or more marks isA1250B875C775D675 - Question 3 - Select One
The following table shows the number of students enrolled in different faculties in college.

The percentage of students studying in faculties other than Science is:A75%B80%C60%D20%
The following table shows the interest of students of a school in different games :

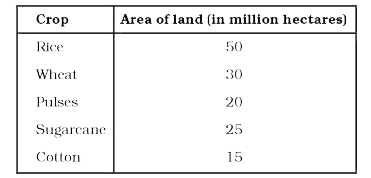
Represent the data by using a simple bar diagram.View SolutionThe following table shows the area of the land on which different crops were grown.

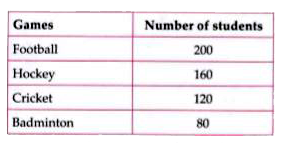
Prepare a pictograph by choosing a suitable symbol to represent 10 million hectares.View SolutionThe table shows the number of students playing four different games.

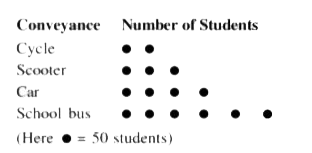
Present this information as a pictograph.View SolutionThe following pictograph shows different using conveyance by the students of a school:

What per cent of students used school bus?View SolutionA school library has different subject books, as shown in the following pictograph-

One □ symbol represents 50 books. Read the pictograph and answer the following question-
Which subject books are minimum in number?View Solution
