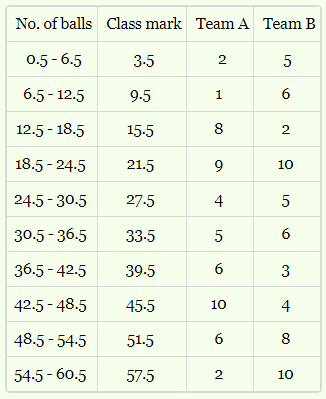
The runs scored by two teams A and B in first 10 overs are given below: Overs, I, II, III, IV, V, VI, VII, VIII, IX, X Team A:, 2, 1, 8, 9, 4, 5, 6, 10, 6, 2 Team B:, 5, 6, 2, 10, 5, 6, 3, 4, 8, 10 Draw a graph depicting the data, making the graphs on the same axes in each case in two different ways as a graph and as a bar chart.
Class interval are not continuous. Because of gap of 1, 0.5 has to added and subtracted from upper and lower class limits.

The polygon graph is

Topper's Solved these Questions
- STATISTICSBOOK - NCERT ENGLISHCHAPTER - STATISTICSEXERCISE - EXERCISE 14.1
2 Videos
- STATISTICSBOOK - NCERT ENGLISHCHAPTER - STATISTICSEXERCISE - Exercise 14.2
9 Videos
- STATISTICSBOOK - NCERT ENGLISHCHAPTER - STATISTICSEXERCISE - Solved Examples
14 Videos
- QUADRILATERALSBOOK - NCERT ENGLISHCHAPTER - QUADRILATERALSEXERCISE - Exercise 8.2
7 Videos
- SURFACE AREAS AND VOLUMESBOOK - NCERT ENGLISHCHAPTER - SURFACE AREAS AND VOLUMESEXERCISE - Exercise 13.9
3 Videos
Similar Questions
The runs scored by a cricket team in first 10 over are given below: Overs:, I, II, III, IV, V, VI, VII, VIII, IX, X Runs:, 2, 3, 1, 6, 4, 3, 8, 12, 4, 10. Draw a graph representing the above data.
View SolutionThe runs scored by a cricket team in first 15 overs are given below: Overs, I, II, III, IV, V, VI, VII, VIII, IX, X, XI, XII, XIII, XIV, XV Runs:, 2, 1, 4, 2, 6, 8, 10, 21, 5, 8, 3, 2, 6, 8, 12 Draw the graph representing the above data in two different ways as a graph and as a bar chart.
View SolutionIfA={1,2,3,4,5,6}B={2,4,5,6,8,9,10},findAΔB.
View SolutionFind the mode of
(i) 7, 7, 8, 10, 10, 11,13, 14
(ii) 4, 5, 6, 7, 8, 7, 6, 5, 3, 4, 6, 7, 6
View SolutionConstruct a frequency table for the following data:
(i) 6,7,5, 6, 8, 9, 5, 5, 6, 7, 8, 9, 8, 10, 10, 9, 8, 10, 5, 7, 6,8
(ii) 3,2,1,5, 4, 3, 2, 5, 5, 4, 2, 2, 2, 1,4,1,5,4
View SolutionThe points scored by a basket ball team in a series of matches are as follows
17, 2, 7, 27, 25, 5, 14, 18, 10, 24, 48, 10, 8, 7, 10, 28
Find the median and mode for the data.
View SolutionFind the standard deviation for the following data: (i) x: , 3, 8, 13, 18, 23 f: , 7, 10, 15, 10, 6 (ii) x: , 2, 3, 4, 5, 6, 7, 7 f: , 4, 9, 16, 14, 11, 6, 6
View SolutionThe points scored by a Kabaddi team in a series of matches are as follows: 17, 2, 7, 27, 15, 5, 14, 8, 10, 24, 48, 10, 8, 7, 18, 28 Find the median of the points scored by the team.
View SolutionIf A={3,6,9,12,15,18,21}, B={4,8,12,16,20},C={2,4,6,8,10,12,14,16}, D={5,10,15,20}; find(i) A−B (ii) A−C (iii) A−D
View SolutionVariance of the data 2,4,6,8,10 is
View Solution
