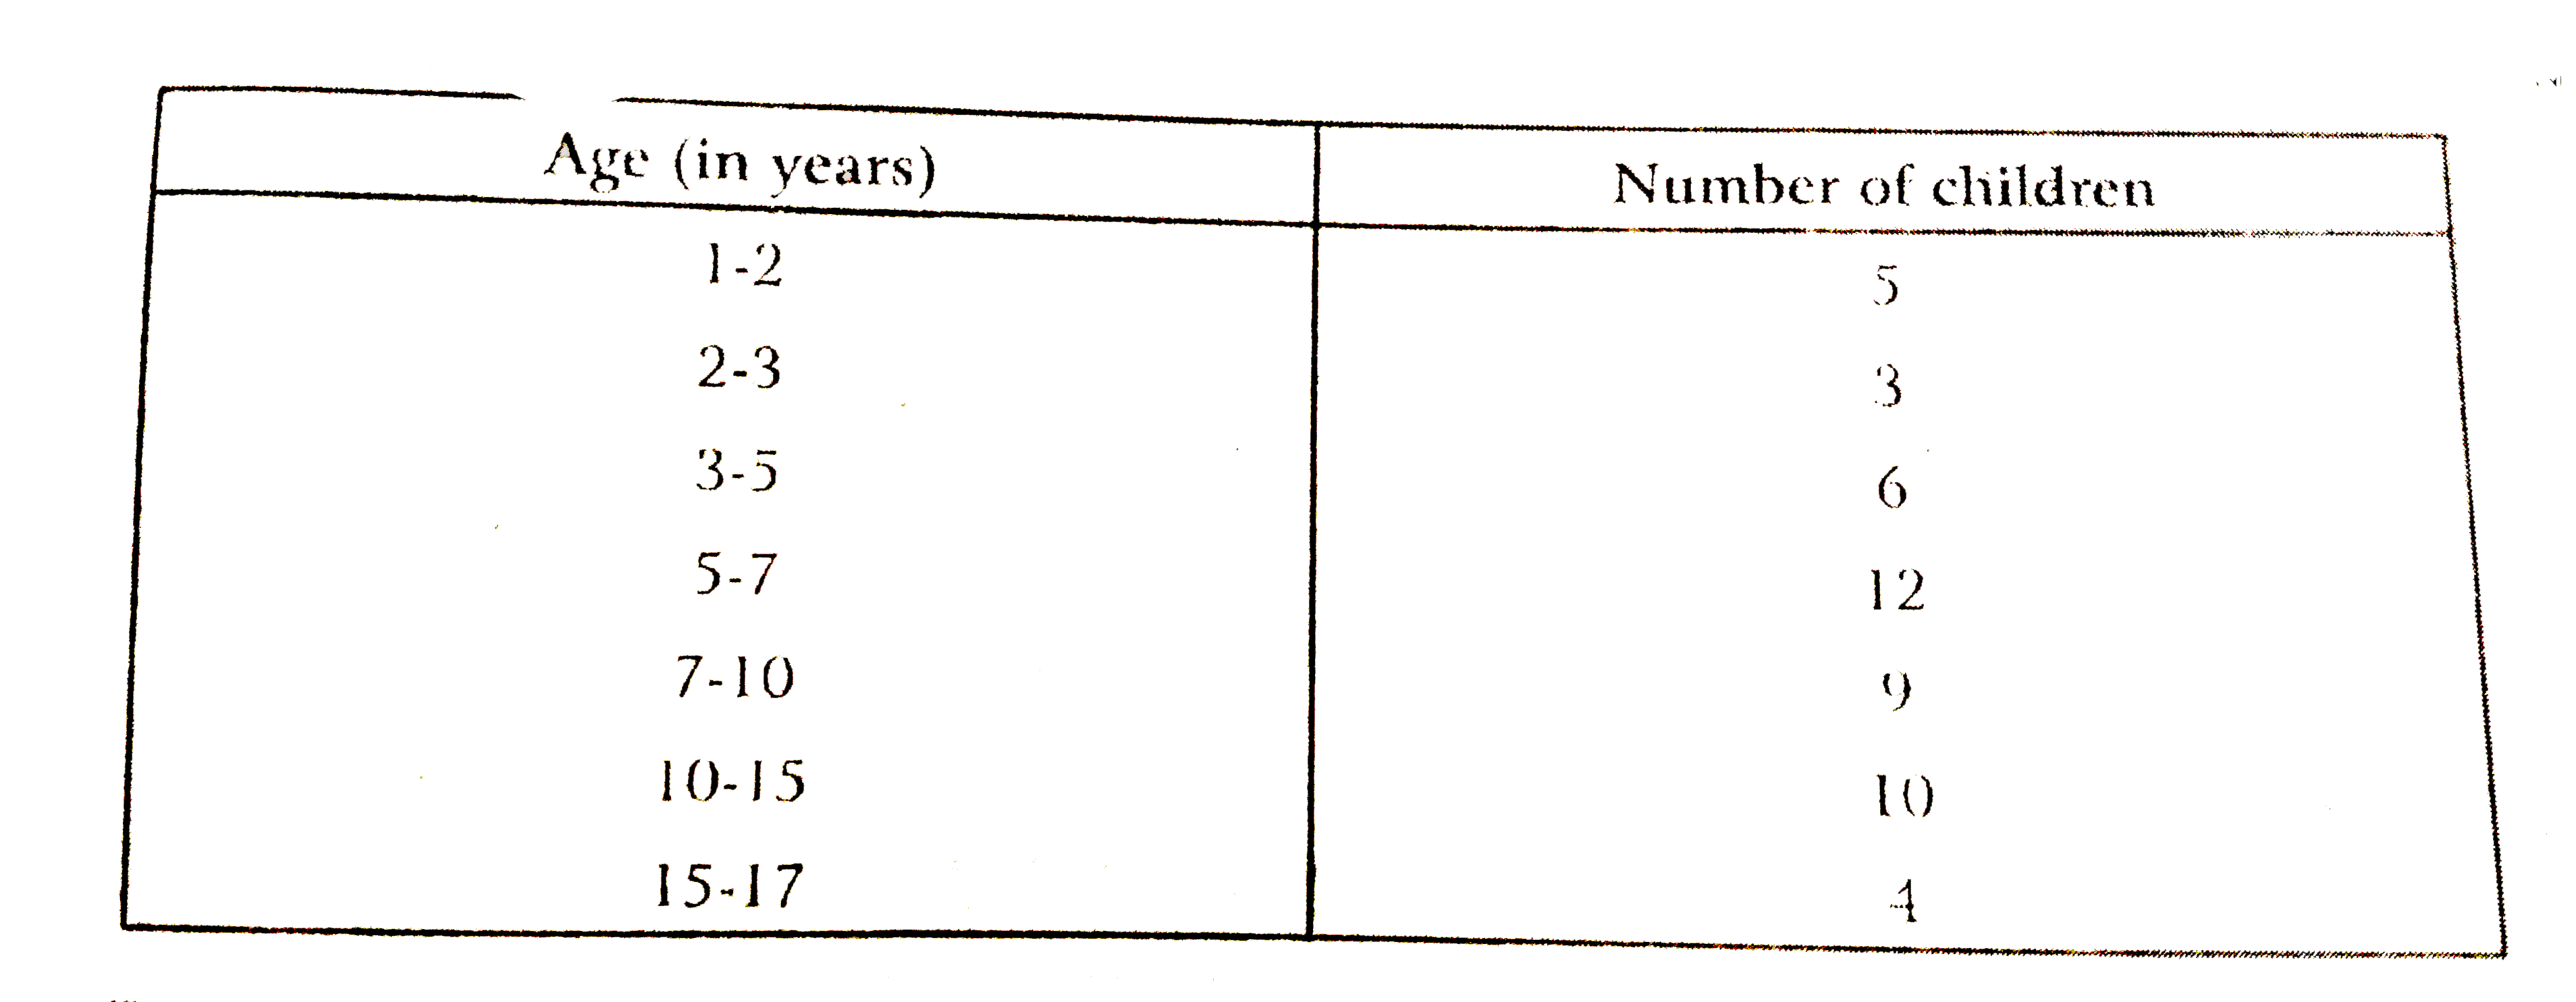
A random survey of the number of children of various are groups playing in park was found as follows :

Draw a histogram to represent the data above.
Video Solution
Text Solution
Please refer to video to see the histogram for the given data.
|
Similar Questions
Draw a histogram to represent the following

View SolutionDraw a histogram to represent the following:

View SolutionDraw a histogram to represent the following :

View SolutionDraw a histogram for the following data :

View SolutionDraw a histogram for the following data:

View SolutionDraw a histogram for the following data:

View SolutionDraw a histogram for the following data:

View SolutionDraw a histogram for the following data:

View SolutionDraw a histogram from the following data:

View Solution100 surnames were randomly picked up from a local telephone directory and a frequency distribution of the number of letter in English alphabet in the surnames was found as follows:

(i) Draw a histogram to depict the given information.
(ii) Write the class interval in which the maximum number of surnames lie.
View Solution
