The runs scored by two teams A and B on the first 60 balls in a cricket match are given below:
![The runs scored by two teams A and B on the first 60 balls in a cricket match are given below: Represent the data of both the teams on the same graph by frequency polygons. [Hint: First make the class intervals continuous]](https://d10lpgp6xz60nq.cloudfront.net/physics_images/MTG_FOU_COU_MAT_IX_C14_E01_031_Q01.png)
Represent the data of both the teams on the same graph by frequency polygons. [Hint: First make the class intervals continuous]
Step by step video & image solution for The runs scored by two teams A and B on the first 60 balls in a cricket match are given below: Represent the data of both the teams on the same graph by frequency polygons. [Hint: First make the class intervals continuous] by Maths experts to help you in doubts & scoring excellent marks in Class 9 exams.
Updated on:21/07/2023Topper's Solved these Questions
- STATISTICSBOOK - MTG IIT JEE FOUNDATIONCHAPTER - STATISTICSEXERCISE - NCERT SECTION (Exercise 14.4)
7 Videos
- STATISTICSBOOK - MTG IIT JEE FOUNDATIONCHAPTER - STATISTICSEXERCISE - Exercise (Multiple Choice Question)
50 Videos
- STATISTICSBOOK - MTG IIT JEE FOUNDATIONCHAPTER - STATISTICSEXERCISE - NCERT SECTION (Exercise 14.2)
15 Videos
- QUADRILATERALS BOOK - MTG IIT JEE FOUNDATIONCHAPTER - QUADRILATERALS EXERCISE - Olympiad/HOTS CORNER
15 Videos
- TRIANGLESBOOK - MTG IIT JEE FOUNDATIONCHAPTER - TRIANGLESEXERCISE - OLYMPAID/ HOTS CORNER
10 Videos
Similar Questions
The runs scored by a cricket team in first 10 overs are given below:

Draw a line graph representing the above data.
View SolutionFollowing table gives the distribution of students of sections A and B of a class according to the marks obtained by them.
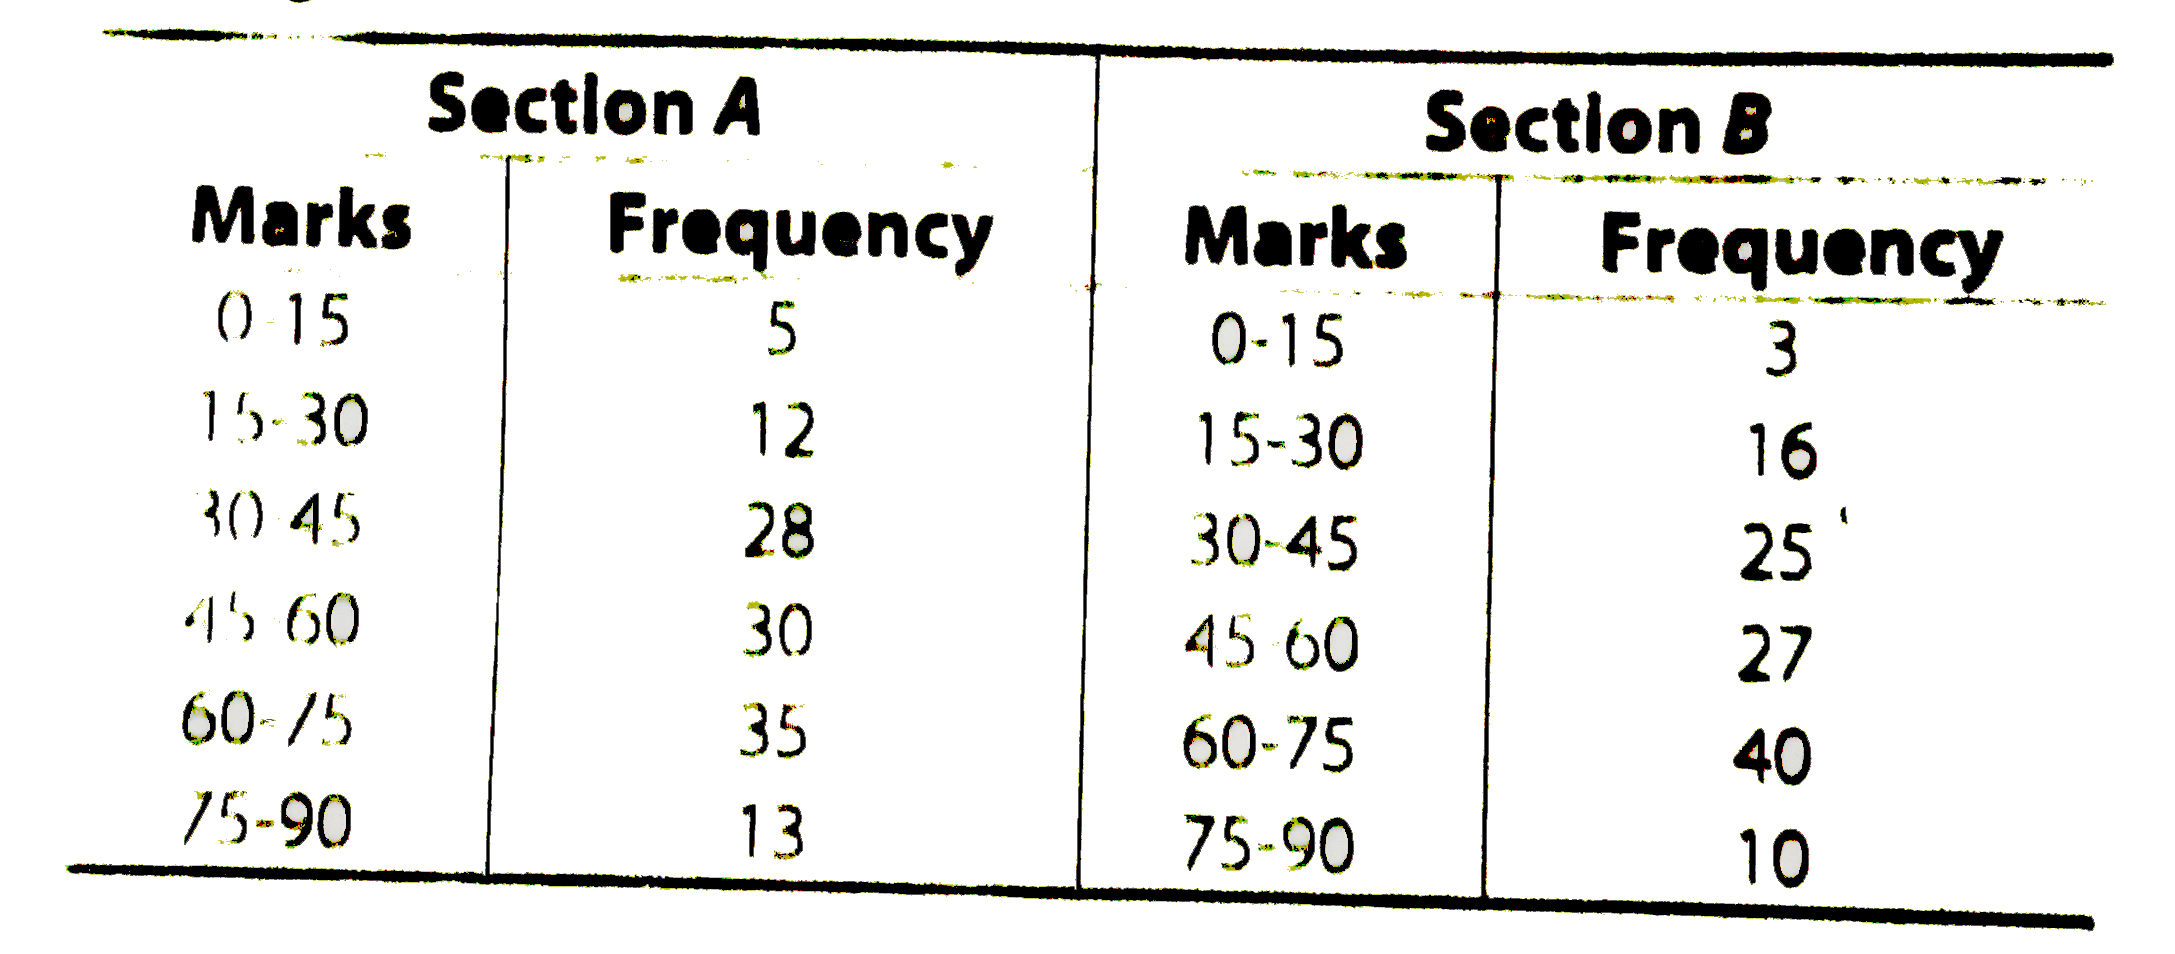
Represent the marks of the students of both the sections on the same graph by two frequency polygons. What do you observe?
View Solution
Knowledge Check
Average runs scored by 11 players of a cricket team is 23. If the first player scored 113 runs. Find the average runs of the remaining players.
A8 runsB12 runsC14 runsD27 runsThe following questions are based on the table given below which represents the distance (in km) travelled by two persons A and B is the same direction :
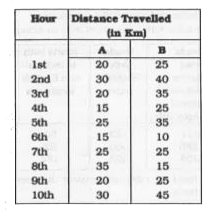
The ratio of A's Average speed during the first five hours and the last five hours isA25:22B22:25C15:22D20:21
The sales of a shopkeeper in the first week of january 2012, are given below :

Draw a graph representing the above data.
View SolutionThe runs scored by two teams A and B on the first 60 balls in a cricket match are given below:
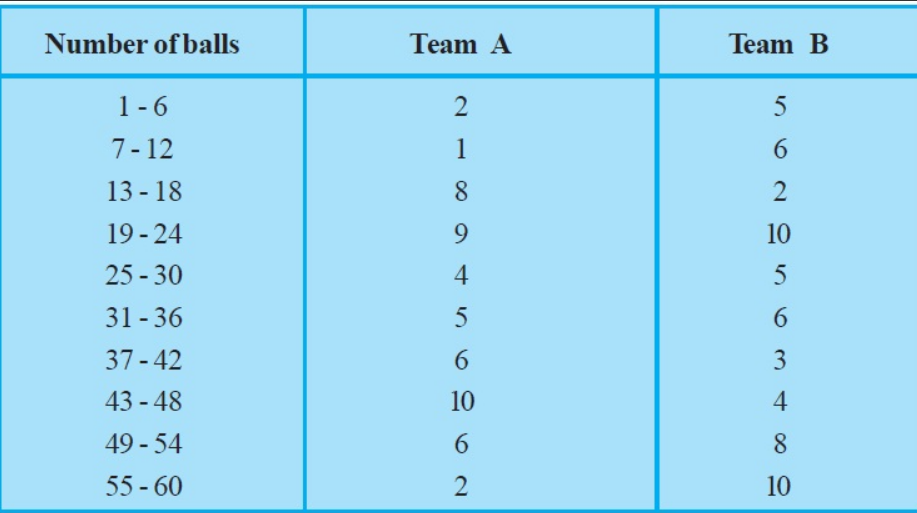
Represent the data of both the teams on the same graph by frequency polygon.
View SolutionThe length of 40 leaves of a plant are measured correct to one millimetre, and the obtained data is represented in the following table:
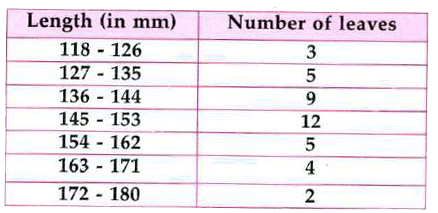
Draw a histogram to represent the given data. [Hint: First make the class intervals continuous]
View SolutionThe line chart given below represents the runs scored by Kohli and Sharma against 5 teams.
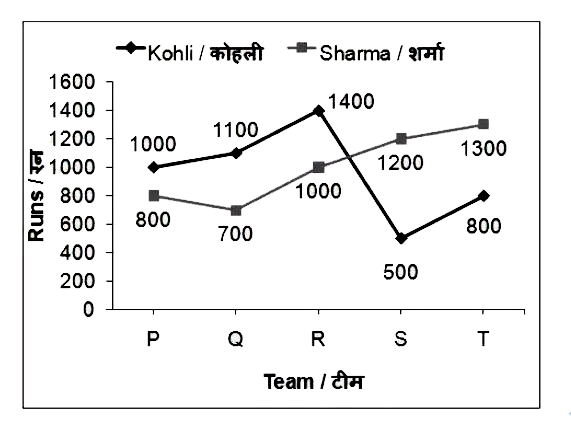
What is the total runs scored by Kohli against 5 teams?
View SolutionThe line chart given below represents the runs scored by Kohli and Sharma against 5 teams.
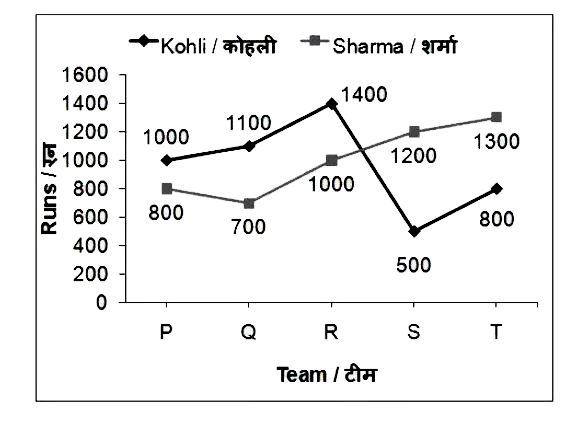
What is the difference between the total runs scored by Kohli against the teams Q and R and total runs scored by Sharma against the teams Q and R?
View Solution(A graph on “performance”)The given graph (Fig 15.7) represents the total runs scored by two batsmen A and B, during each of the ten different matches in the year 2007. Study the graph and answer the following questions.(i) What information is given on the two axes?(ii) Which line shows the runs scored by batsman A?(iii) Were the run scored by them same in any match in 2007? If so, in which match?(iv) Among the two batsmen, who is steadier? How do you judge it?
View Solution
