The total expenditure incurred by an industry under different heads is best presented as a (a) Bar diagram (b) Pie diagram (c) Histogram 2. (d) Frequency Polygon (NDA 2000)
Step by step video & image solution for The total expenditure incurred by an industry under different heads is best presented as a (a) Bar diagram (b) Pie diagram (c) Histogram 2. (d) Frequency Polygon (NDA 2000) by Maths experts to help you in doubts & scoring excellent marks in Class 10 exams.
Similar Questions
The pie-diagram shows the expenditure incurred on the printing of a book by a publisher, under various heads. Study the pie-digram and answer the questions.
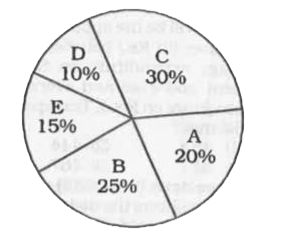
If the expenditure incurred on the printing under head A is Rs. 5000, then the sum of expenditure incurred under heads B and D is:03:59View SolutionThe pie-diagram shows the expenditure incurred on the printing of a book by a publisher, under various heads. Study the pie-digram and answer the questions.
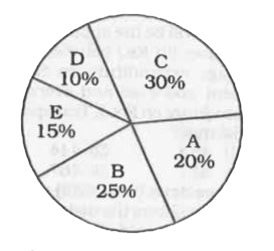
The two expenditures, which together will from an angle of 108∘ at the centre are :04:01View SolutionThe given pie chart shows the distribution of expenditure of a company (in percenatge). The total expenditure of the company is Rs. 136000.
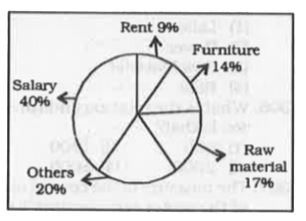
What is the difference (in degrees) in the central angles formed by the total expenditure incurred on Furniture and Rent and expenditure incurred on Others?02:53View SolutionDefine bar graph, histogram, frequency polygon
05:15View SolutionThe given pie chart shows the distribution of expenditure of a company (in percentage) . The total expenditure of the company is Rs. 136000.
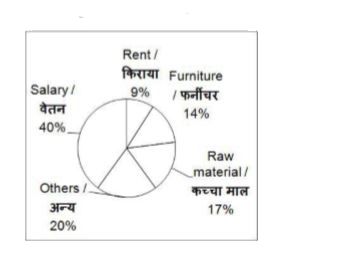
What is the difference (in degrees) in the central angles formed by the total expenditure incurred on Furniture and Rent and expenditure incurred on Others?02:13View SolutionThe following diagram show the expenditure of a family on various Items A ,B,C, D and E .
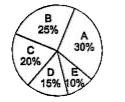
Study the diagram carefully and answer the following questions .
The angle of pie diagram showing the expenditure incurred on item A is01:13View SolutionThe following diagram show the expenditure of a family on various Items A ,B,C, D and E .
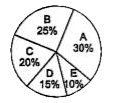
Study the diagram carefully and answer the following questions .
Which two expenditure together will form an angle of 90∘ at the centre of pie diagram ?02:02View SolutionThe total expenditure incurred by an industry under different heads is best presented as a
01:26View Solution
