The total expenditure incurred by an industry under different heads is best presented as a (a) Bar diagram (b) Pie diagram (c) Histogram 2. (d) Frequency Polygon (NDA 2000)
Step by step video & image solution for The total expenditure incurred by an industry under different heads is best presented as a (a) Bar diagram (b) Pie diagram (c) Histogram 2. (d) Frequency Polygon (NDA 2000) by Maths experts to help you in doubts & scoring excellent marks in Class 10 exams.
Updated on:21/07/2023Similar Questions
The percentage of expenditure on different heads in a budget of a state is as shown below :

Draw a pie diagram to represent the information .
View SolutionThe mode of a frequency distribution can be determined graphically from (a) Histogram (b) Frequency polygon (c) Ogive (d) Frequency curve
View Solution
Knowledge Check
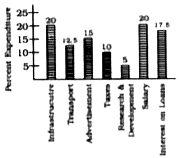
The bar graph shows the percentage distribution of the total expenditure of a company under varios expense heads during 2005. Study the bar graph and answer the following four questions.

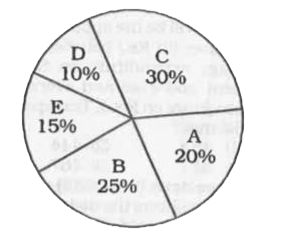
If the interest on loans amounted to Rs. 2.45 crores, then the total amount of expenditure on advertisement, taxes and research and development is equal toARs. 3 croresBRs. 5.4 croresCRs. 4.2 croresDRs. 7 croresThe pie-diagram shows the expenditure incurred on the printing of a book by a publisher, under various heads. Study the pie-digram and answer the questions.

If the expenditure incurred on the printing under head A is Rs. 5000, then the sum of expenditure incurred under heads B and D is:ARs. 5780BRs. 8750CRs. 8570DRs. 7850Different expenditures incurred on the construction of a building were shown by a pie diagram. The expenditure of Rs45000 on current was shown by a sector of central angle of 75∘. What was the total expenditure of the construction?
A216000B360000C450000D750000
The mode of a frequency distribution can be determined graphically from (a) Histogram (b) Frequency polygon (c) Ogive (d) Frequency curve
View SolutionThe median of a given frequency distribution is found graphically with the help of (a) Histogram (b) Frequency curve (c) Frequency polygon (d) Ogive
View SolutionThe median of a given frequency distribution is found graphically with the help of (a) Histogram (b) Frequency curve (c) Frequency polygon (d) Ogive
View SolutionWhich one of the following is not the graphical representation of statistical data: bar graph (b) Histogram Frequency polygon (d) Comulative frequency distribution
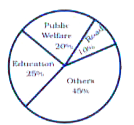
View SolutionThe following pie chart depicts the expenditure of a state government under different heads,(if the total spending is 10 crores)

How many times is the amount of money Others spent on education compared to the amount spent on roads?
View Solution
