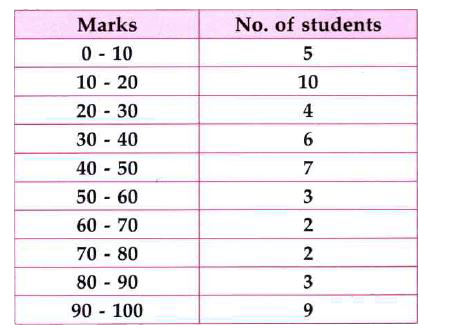
Define bar graph, histogram, frequency polygon
Step-by-Step Text Solution:
1. Definition of Bar Graph:
- A bar graph is a pictorial representation of data that uses bars to compare different categories of data. Each bar represents a category, and the height or length of the bar corresponds to the value or frequency of that category.
2. Definition of Histogram:
- A histogram is a graphical representation that shows the frequency distribution of continuous data. In a histogram, the data is divided into intervals (or bins), and the height of each bar represents the frequency of data points within that interval. Unlike a bar graph, the bars in a histogram touch each other, indicating that the data is continuous.
3. Definition of Frequency Polygon:
- A frequency polygon is a line graph that represents the class frequencies of a dataset. It is created by plotting the midpoints of the intervals (or bins) of a histogram on the x-axis and the corresponding frequencies on the y-axis. The points are then connected by straight lines. This graph provides a visual representation of the distribution of the data.
- A bar graph is a pictorial representation of data that uses bars to compare different categories of data. Each bar represents a category, and the height or length of the bar corresponds to the value or frequency of that category.
- A histogram is a graphical representation that shows the frequency distribution of continuous data. In a histogram, the data is divided into intervals (or bins), and the height of each bar represents the frequency of data points within that interval. Unlike a bar graph, the bars in a histogram touch each other, indicating that the data is continuous.
- A frequency polygon is a line graph that represents the class frequencies of a dataset. It is created by plotting the midpoints of the intervals (or bins) of a histogram on the x-axis and the corresponding frequencies on the y-axis. The points are then connected by straight lines. This graph provides a visual representation of the distribution of the data.
Topper's Solved these Questions
- STATISTICSBOOK - MTG IIT JEE FOUNDATIONCHAPTER - STATISTICSEXERCISE - Exercise ( Subjective Problems ) ( Short Answer Type )
10 Videos
- STATISTICSBOOK - MTG IIT JEE FOUNDATIONCHAPTER - STATISTICSEXERCISE - Exercise ( Subjective Problems ) ( Long Answer Type )
6 Videos
- STATISTICSBOOK - MTG IIT JEE FOUNDATIONCHAPTER - STATISTICSEXERCISE - Exercise (Comprehension Type)
9 Videos
- QUADRILATERALS BOOK - MTG IIT JEE FOUNDATIONCHAPTER - QUADRILATERALS EXERCISE - Olympiad/HOTS CORNER
15 Videos
- TRIANGLESBOOK - MTG IIT JEE FOUNDATIONCHAPTER - TRIANGLESEXERCISE - OLYMPAID/ HOTS CORNER
10 Videos
Similar Questions
Define frequency polygon.
View SolutionFrom the following data, construct frequency histogram, frequency polygon and frequency curve.

View Solution(i)Construct a histogram and frequency polygon of the following distribution :

(ii)Show that the area under frequency polygon is equal to the area under histogram.
View SolutionDraw a histogram, a frequency polygon and frequency curve of the following data :

View SolutionThe following is a frequency distribution of marks:

If a and b are equal, find their values. Draw a histogram and a frequency polygon.
View SolutionFollowing table shows a frequency distribution for the speed of cars passing through at a particular spot on a high way.

Draw a histogram and frequency polygon representing the data above.
View SolutionFor the following data, draw a histogram and a frequency polygon

View SolutionThe following table is based on the marks of the first term examination of 10th class students . Show the information by a histogram. Also, draw a frequency polygon with the help of the histogram :

View SolutionThe following table is based on the marks of the first term examination of 10 th class student. Show the information by a histogram. Also, draw a frequency polygon with the help of the histogram:

View SolutionDraw histogram and frequency polygon for the following distribution :

View Solution
