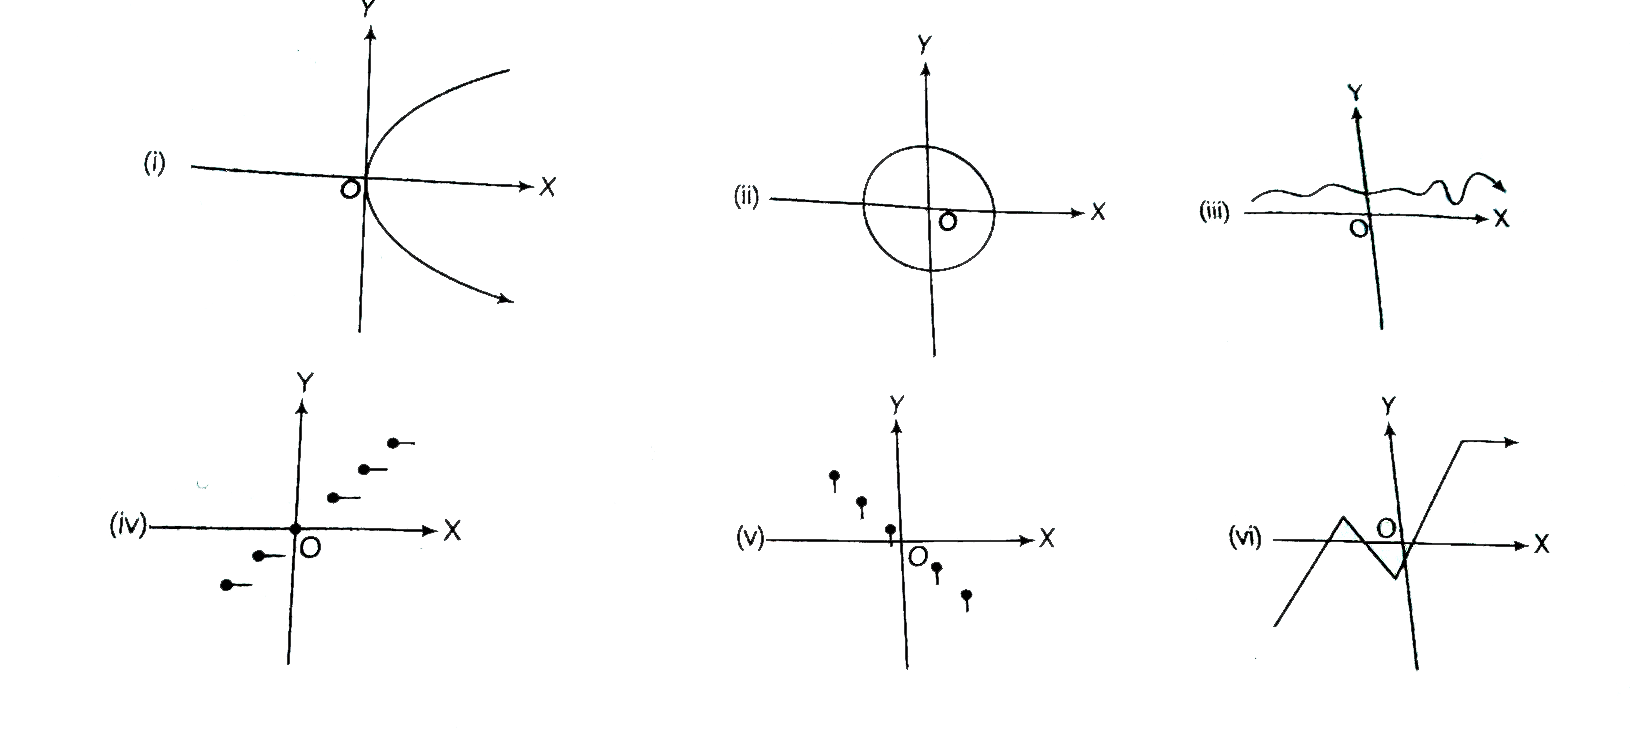
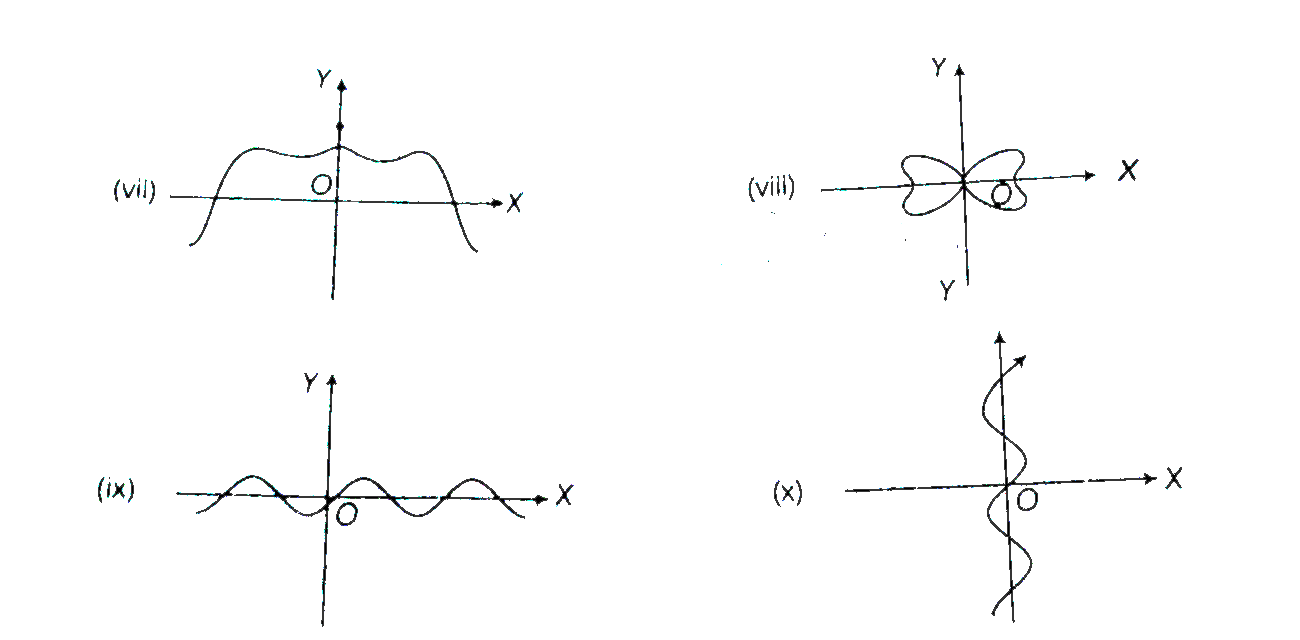
Which of the following graphs are graphs of a function?
Video Solution
Text Solution
The correct Answer is:(i) not a function (ii) not a function (iii) function (iv) function (v) not a function (vi) function (vii) function (viii) not a function (ix) function (x) not a function
|
Answer
Step by step video & image solution for Which of the following graphs are graphs of a function? by Maths experts to help you in doubts & scoring excellent marks in Class 12 exams.
Updated on:21/07/2023Topper's Solved these Questions
- FUNCTIONSBook:ARIHANT MATHS ENGLISHChapter:FUNCTIONSExercise:Exercise For Session 2
Explore 6 Videos
- FUNCTIONSBook:ARIHANT MATHS ENGLISHChapter:FUNCTIONSExercise:Exercise For Session 3
Explore 10 Videos
- FUNCTIONSBook:ARIHANT MATHS ENGLISHChapter:FUNCTIONSExercise:FUNCTION EXERCISE 8:Questions Asked in Previous 10 Years Exams
Explore 1 Video
- ESSENTIAL MATHEMATICAL TOOLS Book:ARIHANT MATHS ENGLISHChapter:ESSENTIAL MATHEMATICAL TOOLS Exercise:Exercise (Single Integer Answer Type Questions)
Explore 3 Videos
- GRAPHICAL TRANSFORMATIONSBook:ARIHANT MATHS ENGLISHChapter:GRAPHICAL TRANSFORMATIONSExercise:Exercise (Questions Asked In Previous 13 Years Exam)
Explore 10 Videos
Similar Questions
Knowledge Check
Which of the following graphs is the graph of function g(x)|x−1|−1?
A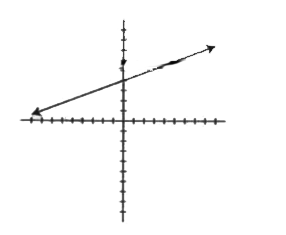 B
B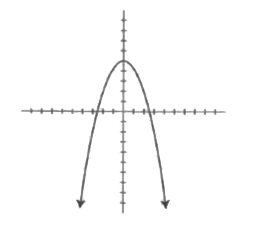 C
C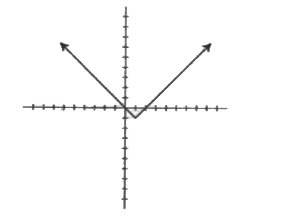 D
D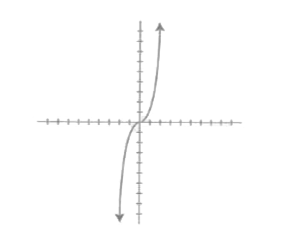
Which of the following graphs is NOT a function ?
A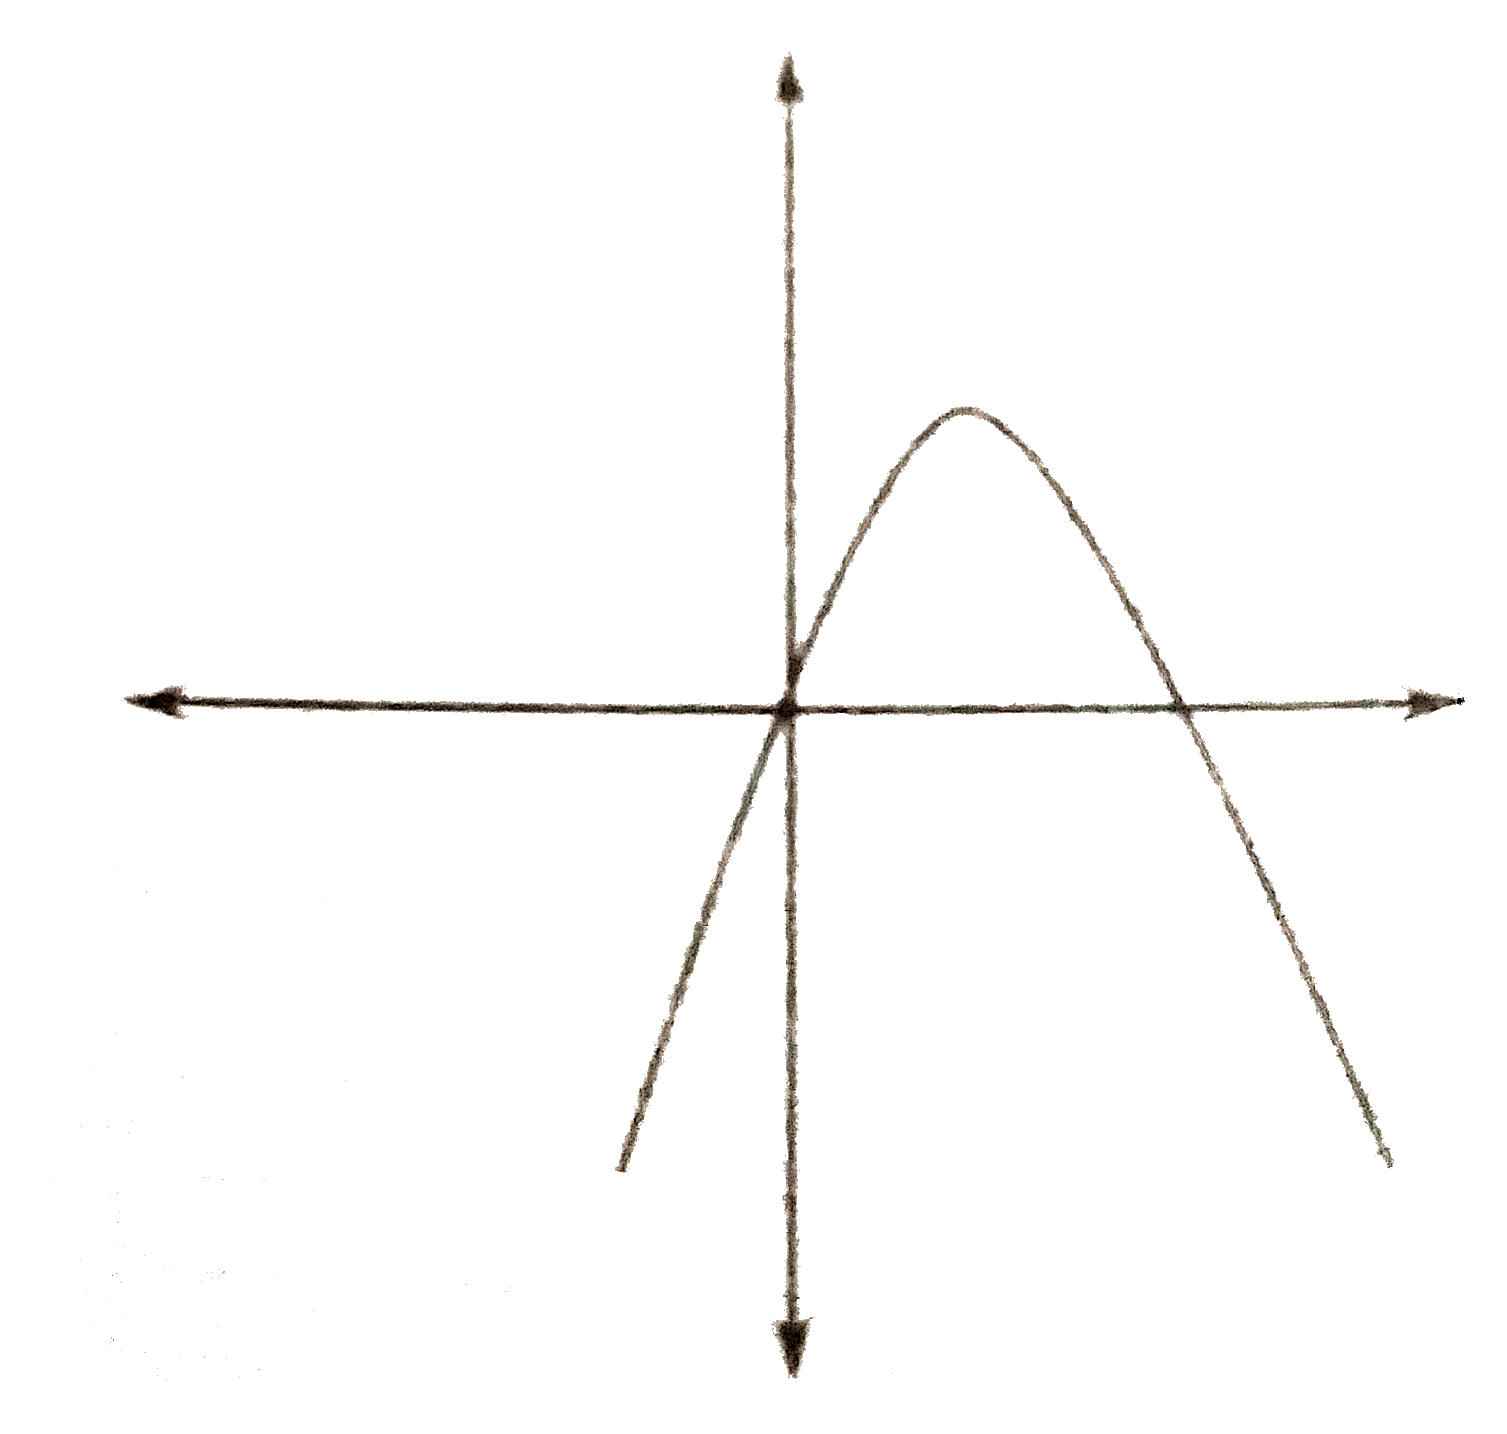 B
B C
C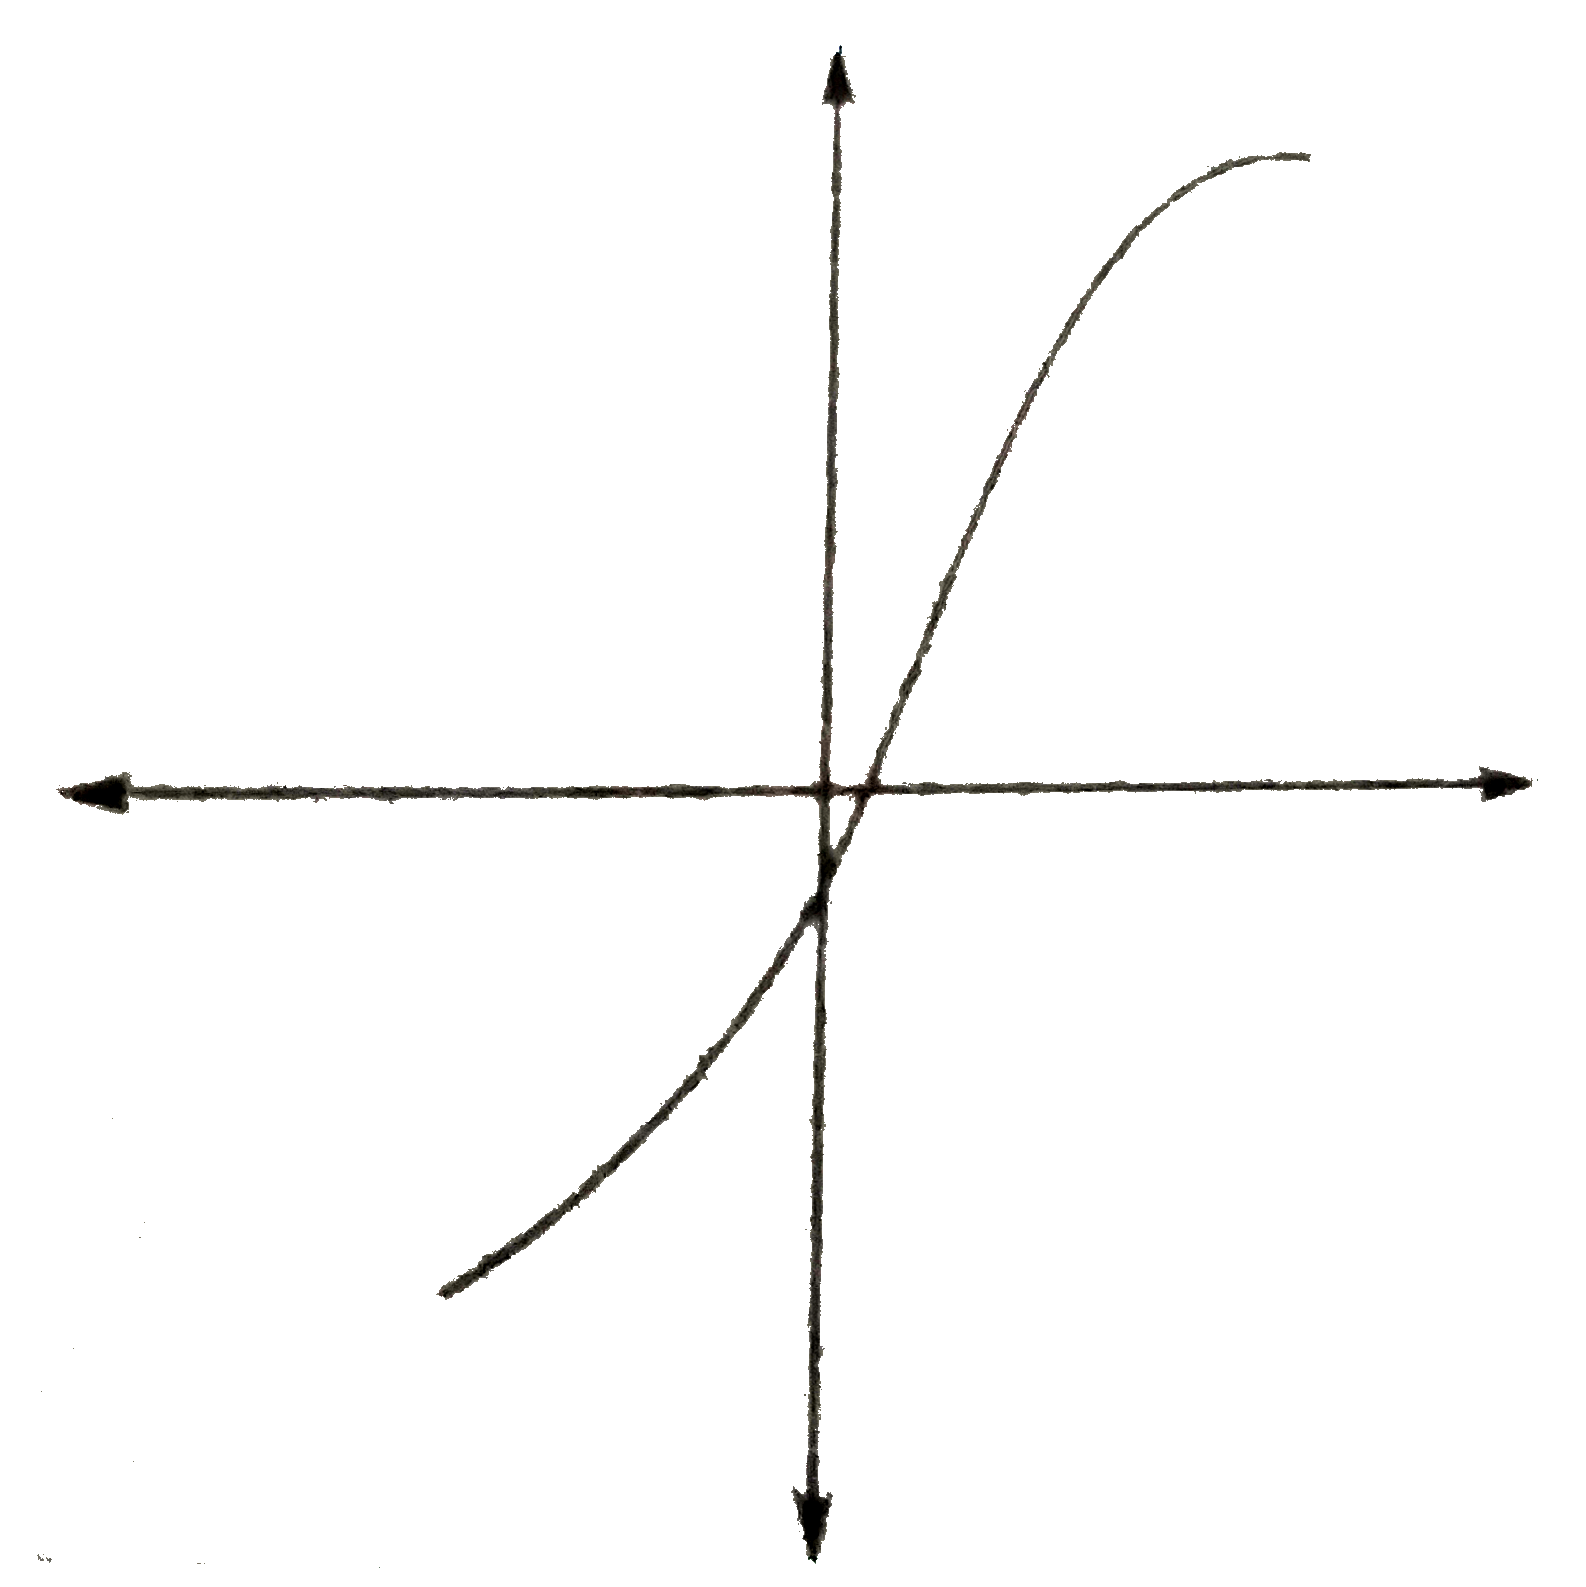 D
D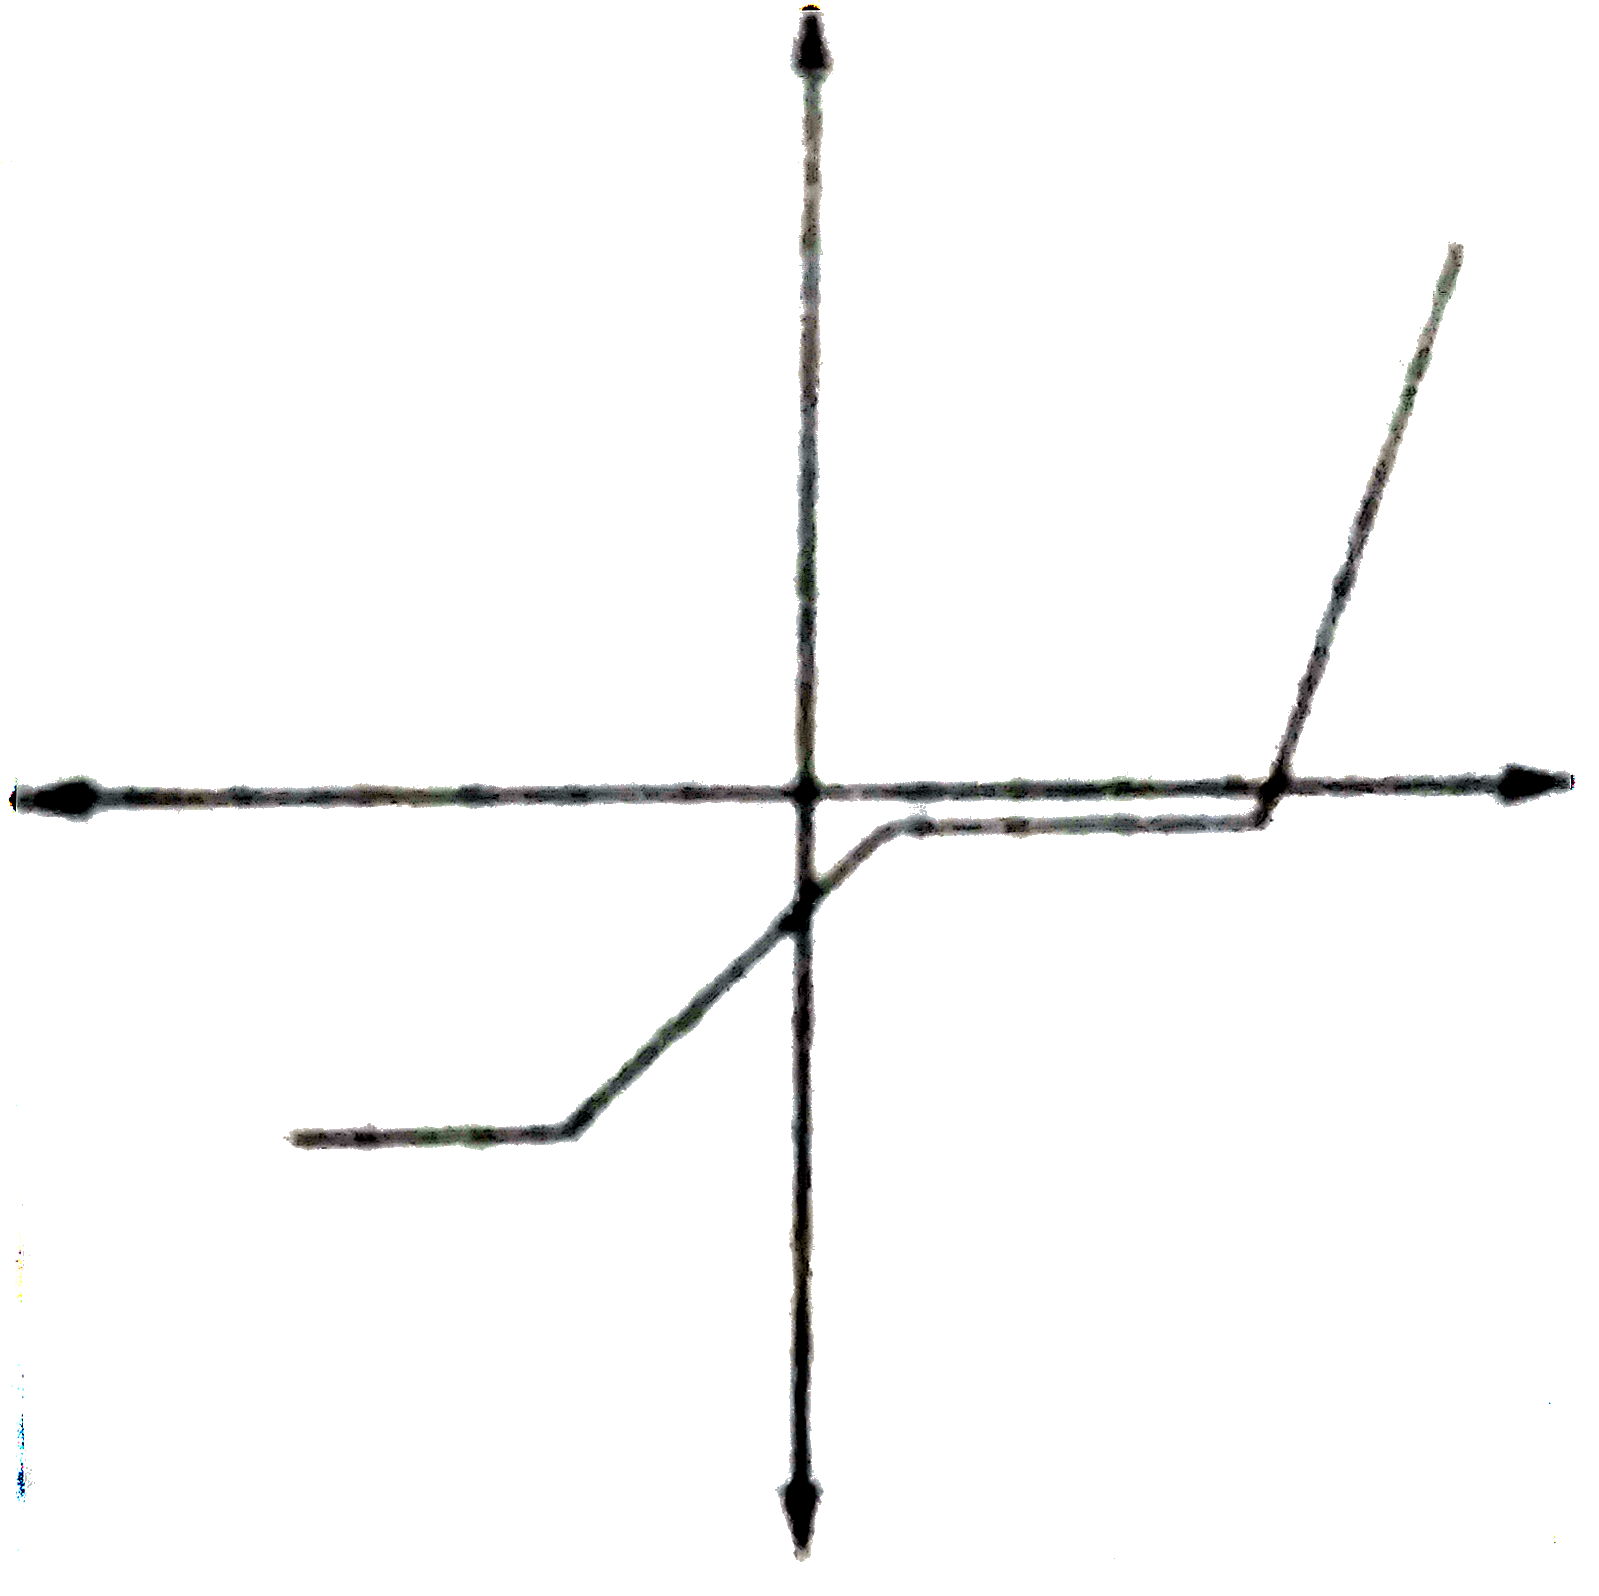
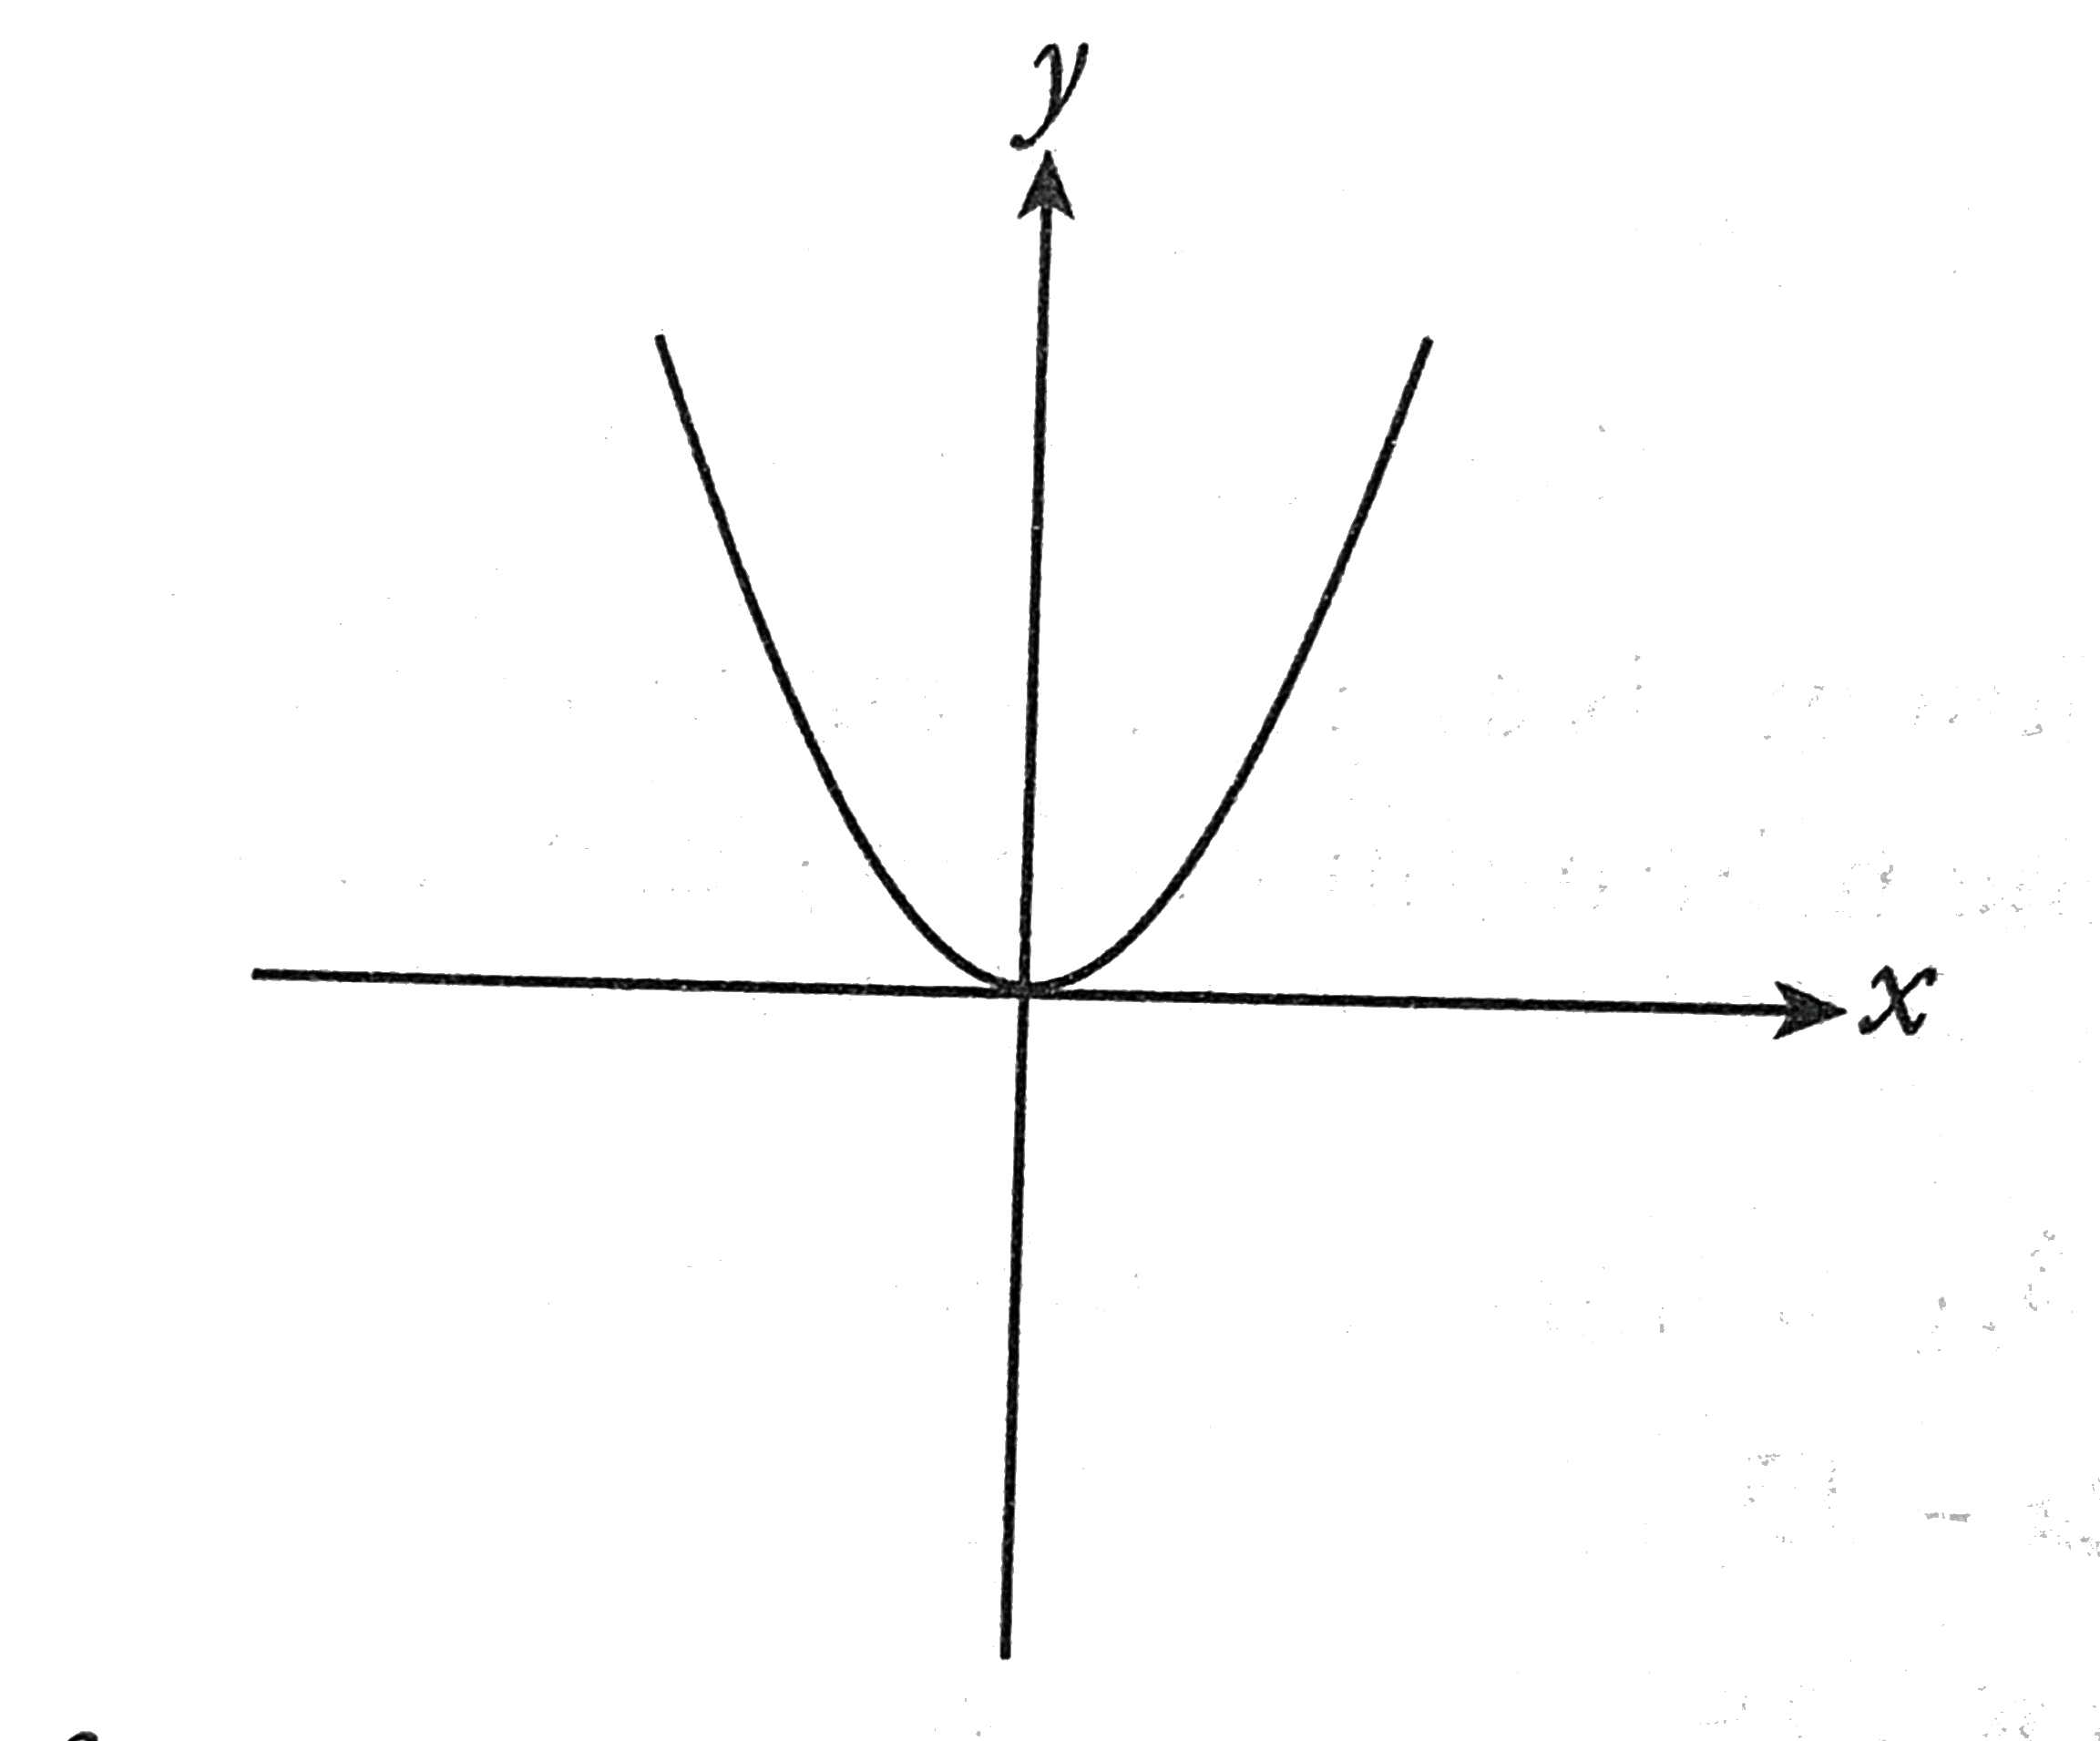
The quadratic y=f(x) is shown above. Which of the following graphs represents the function y=f(x+3)−4?A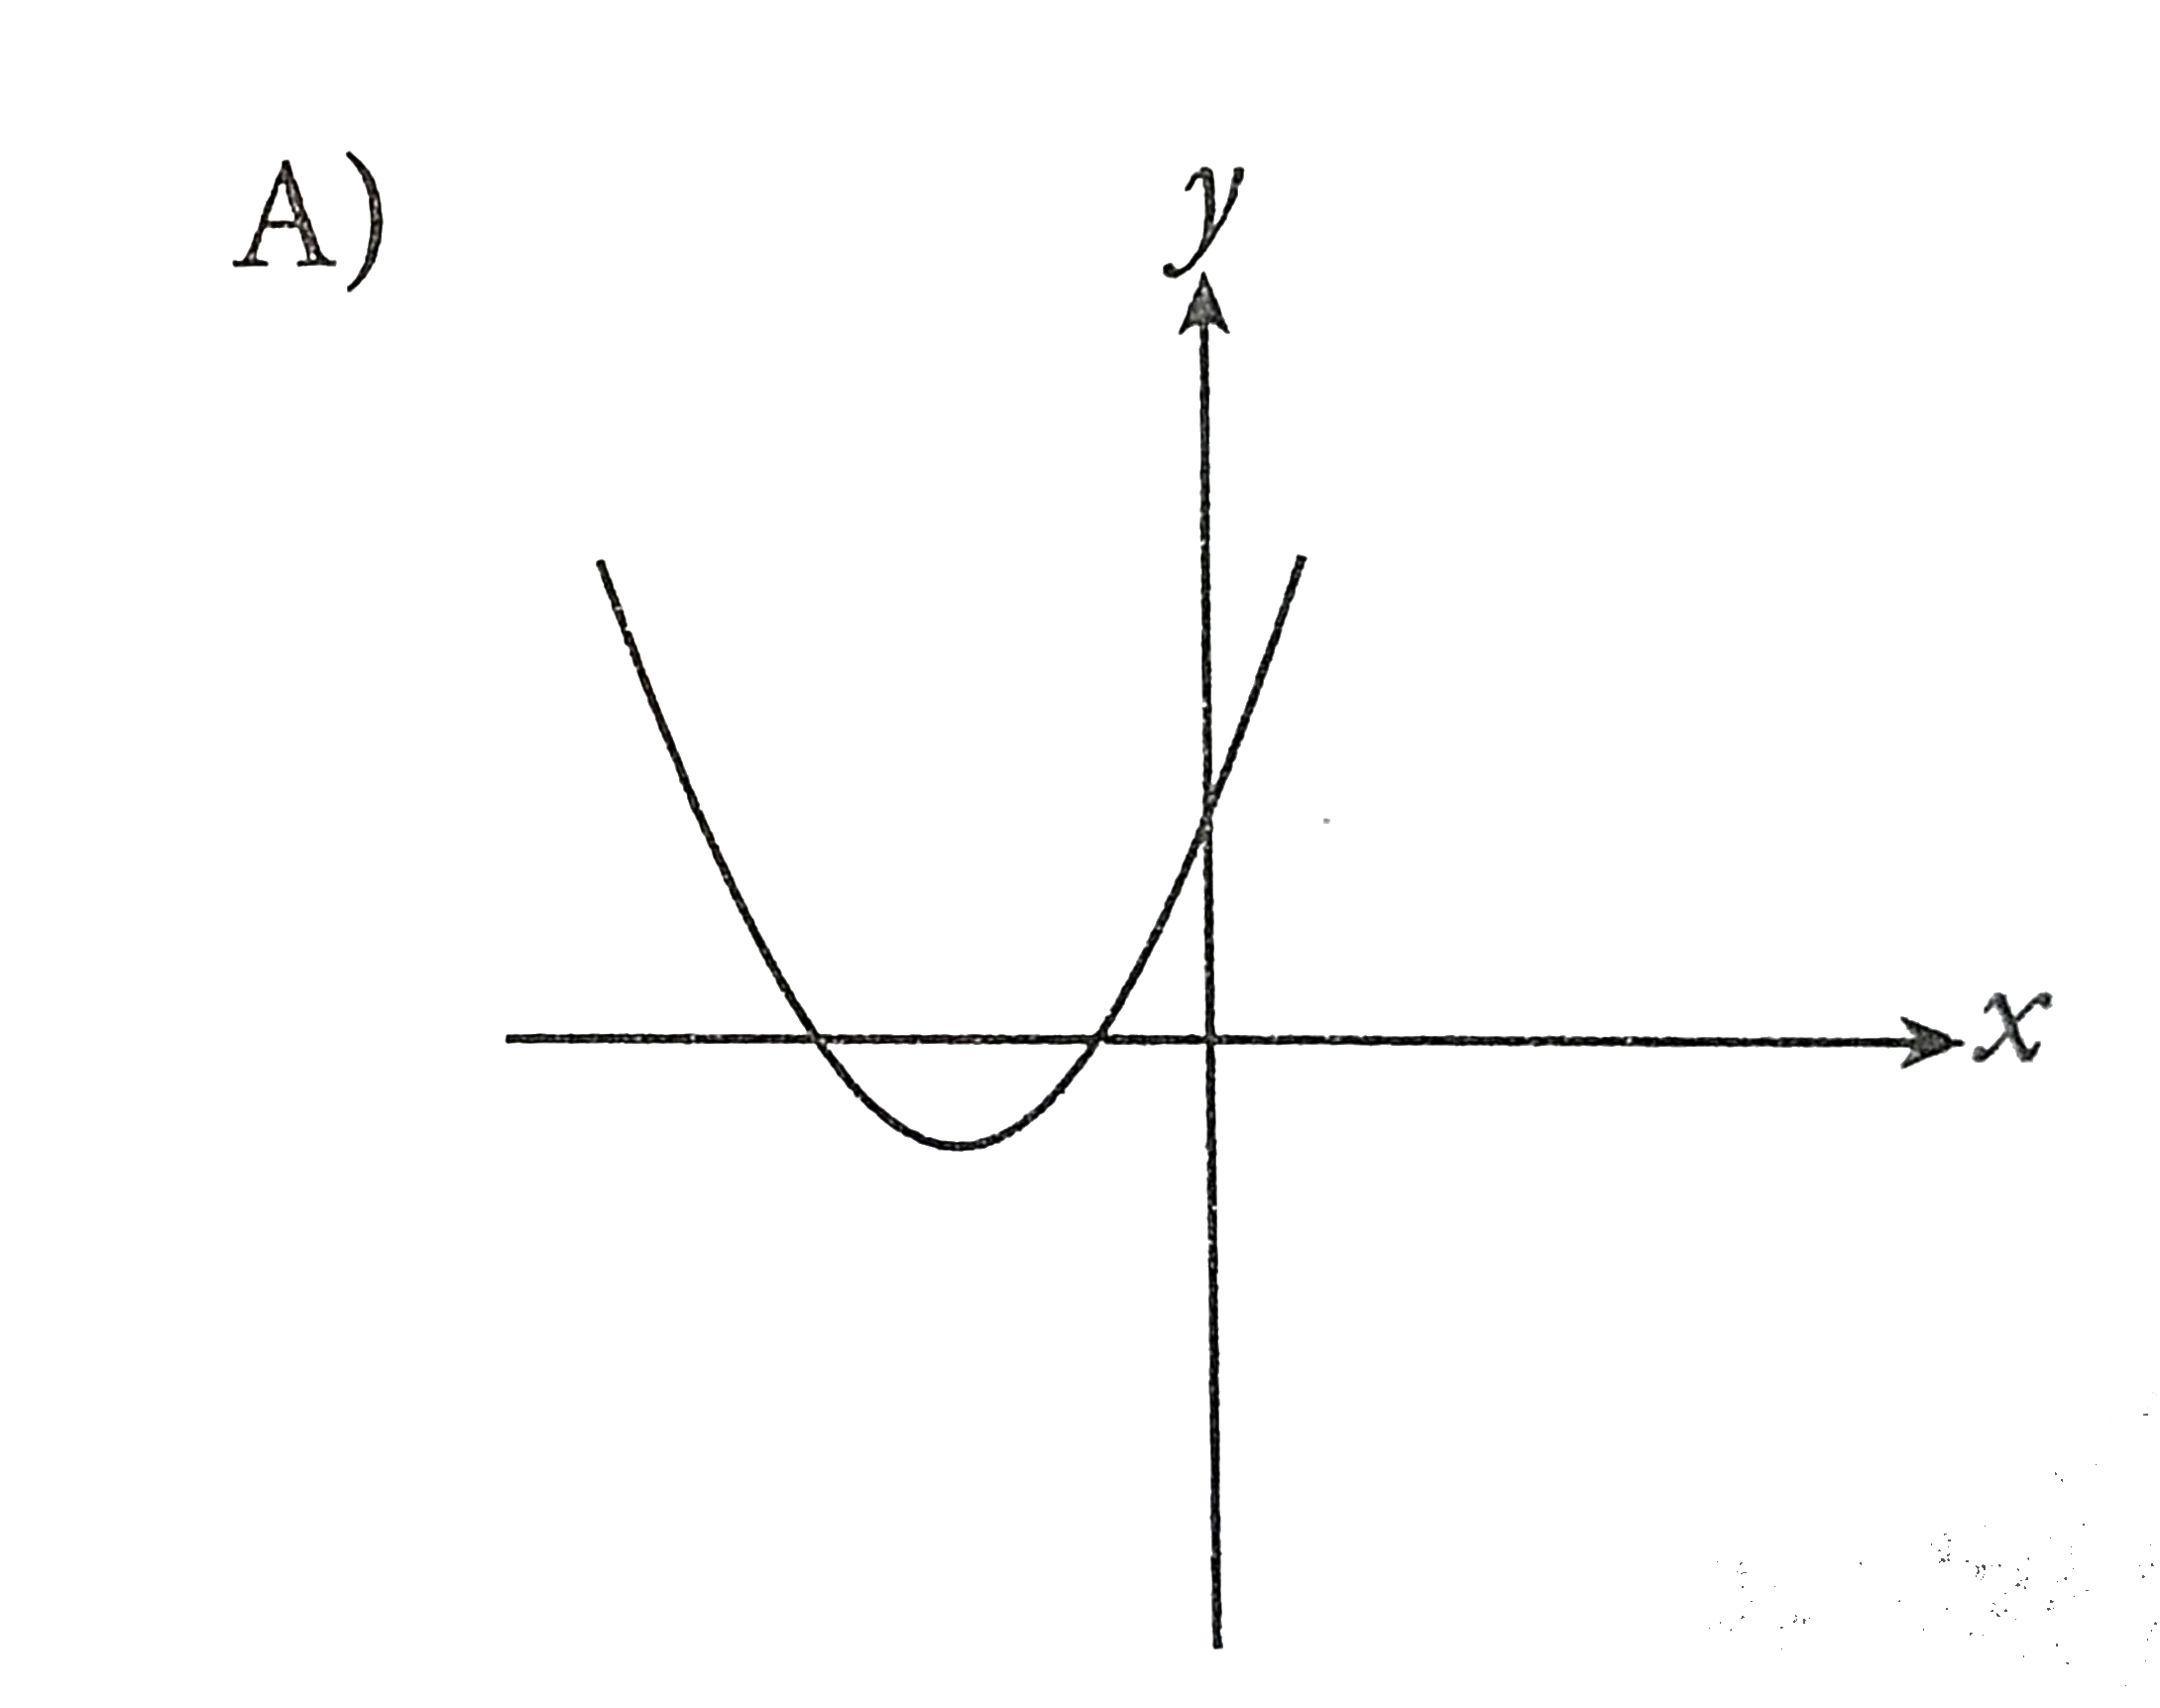 B
B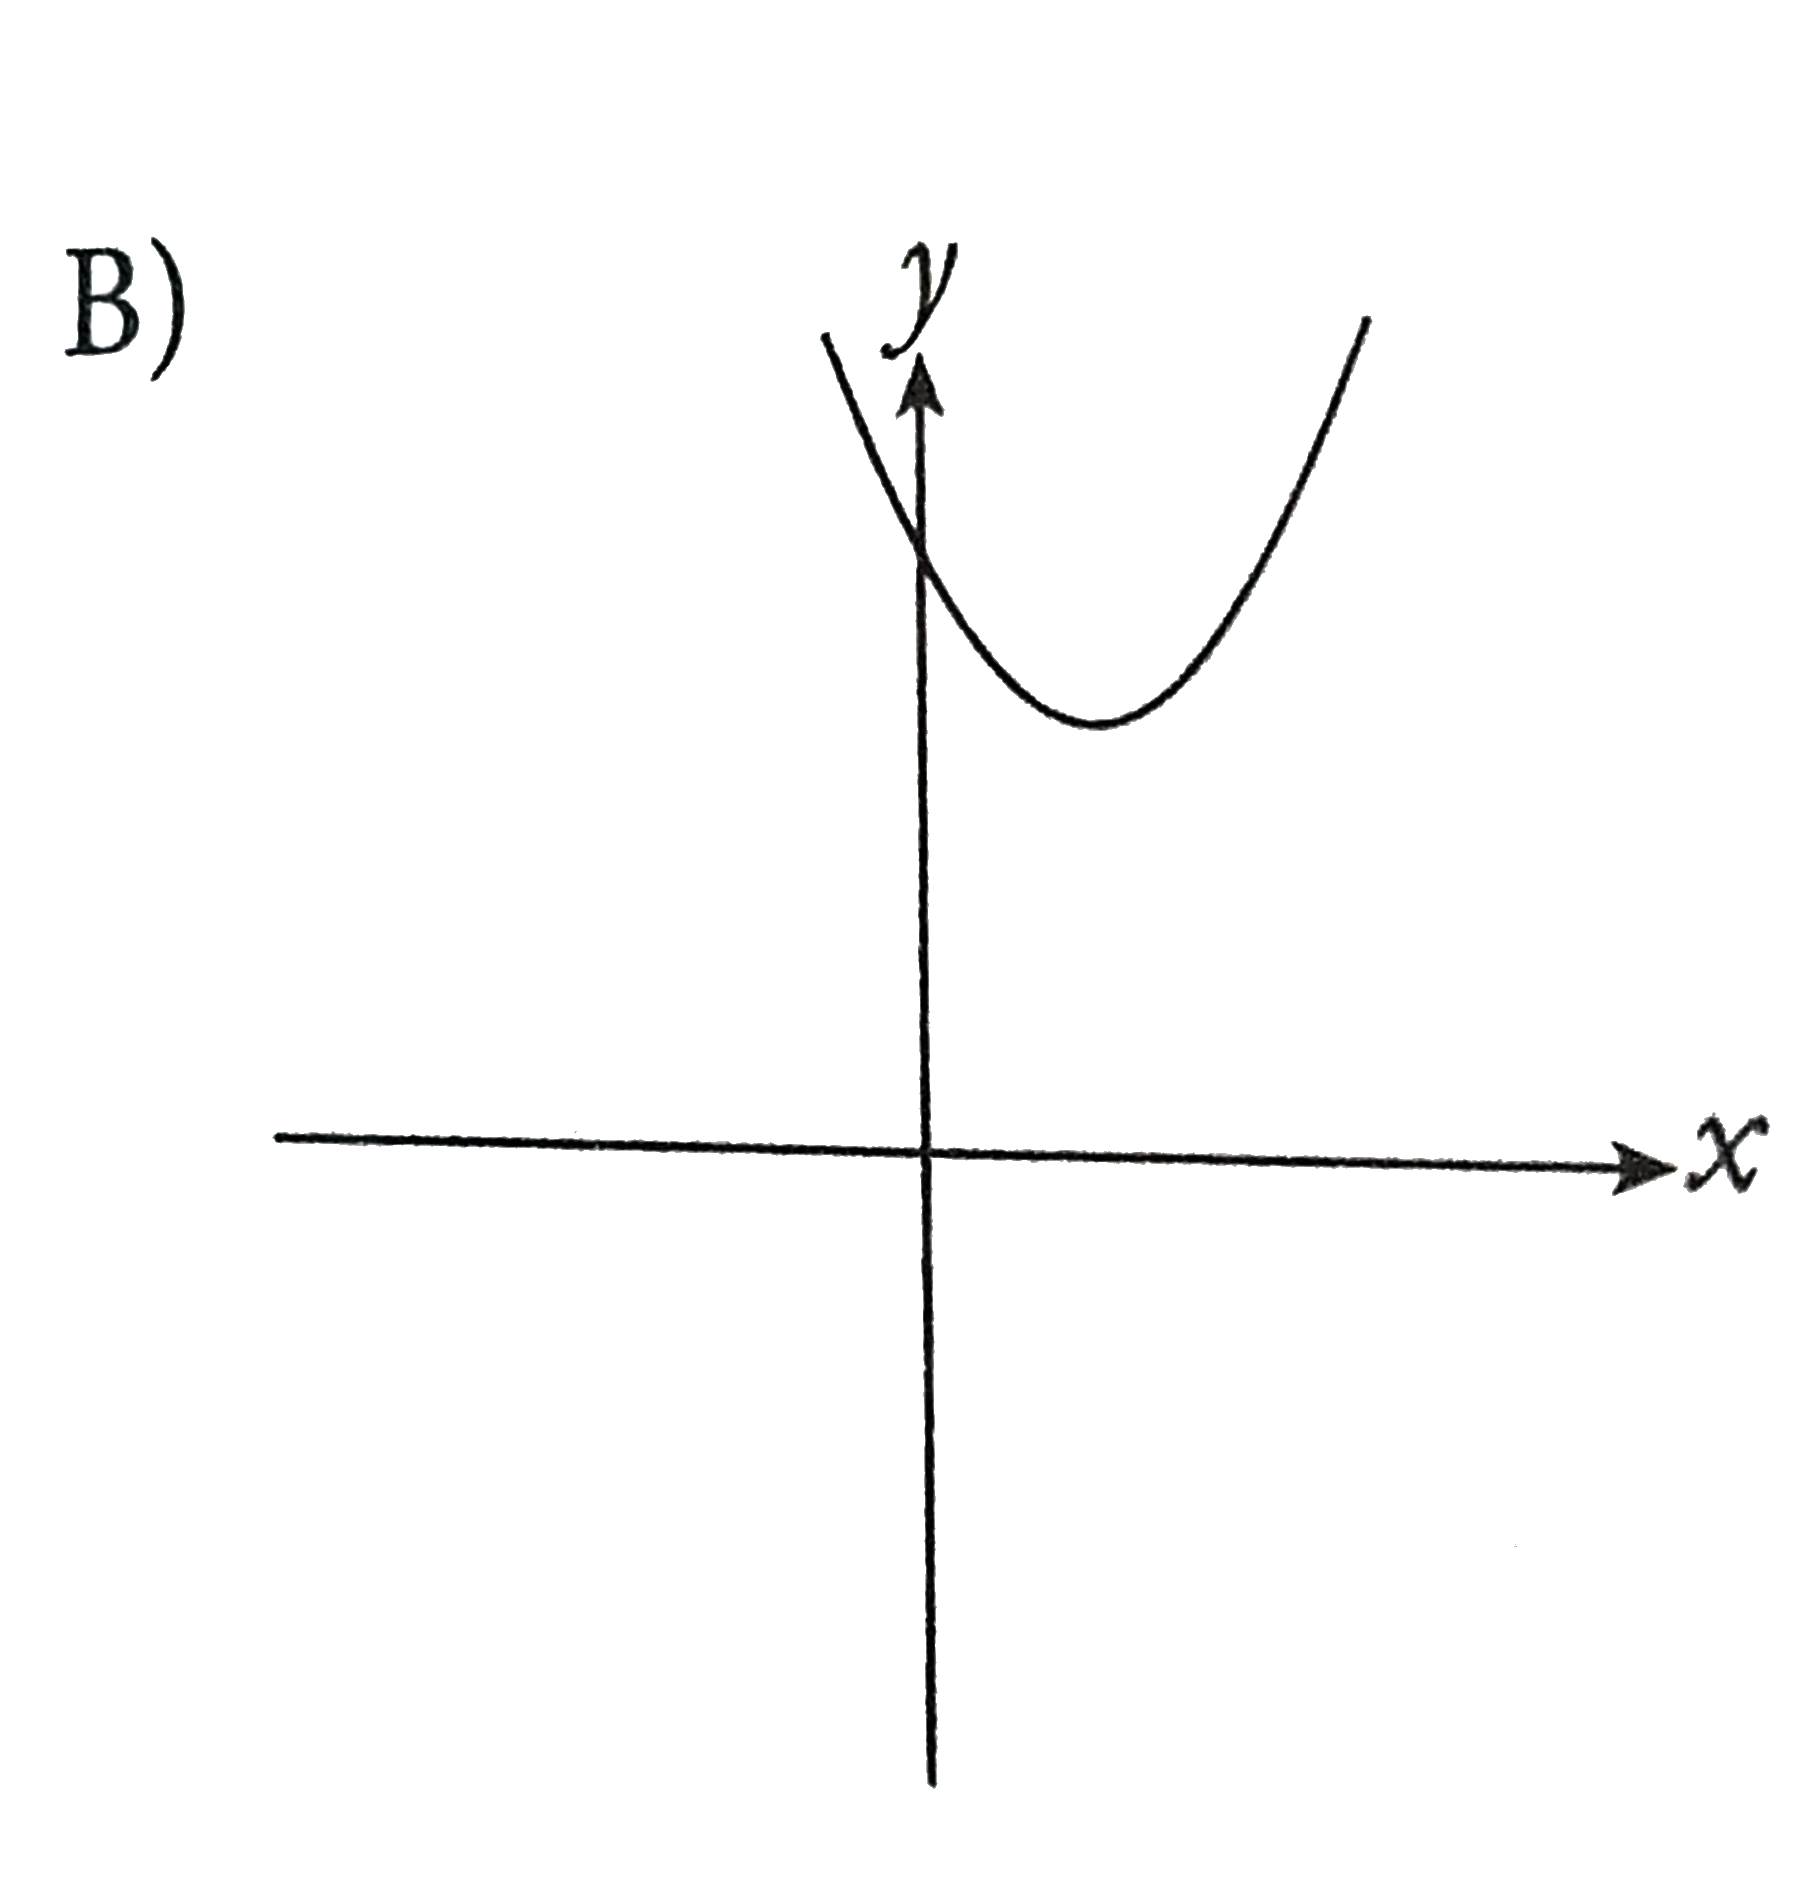 C
C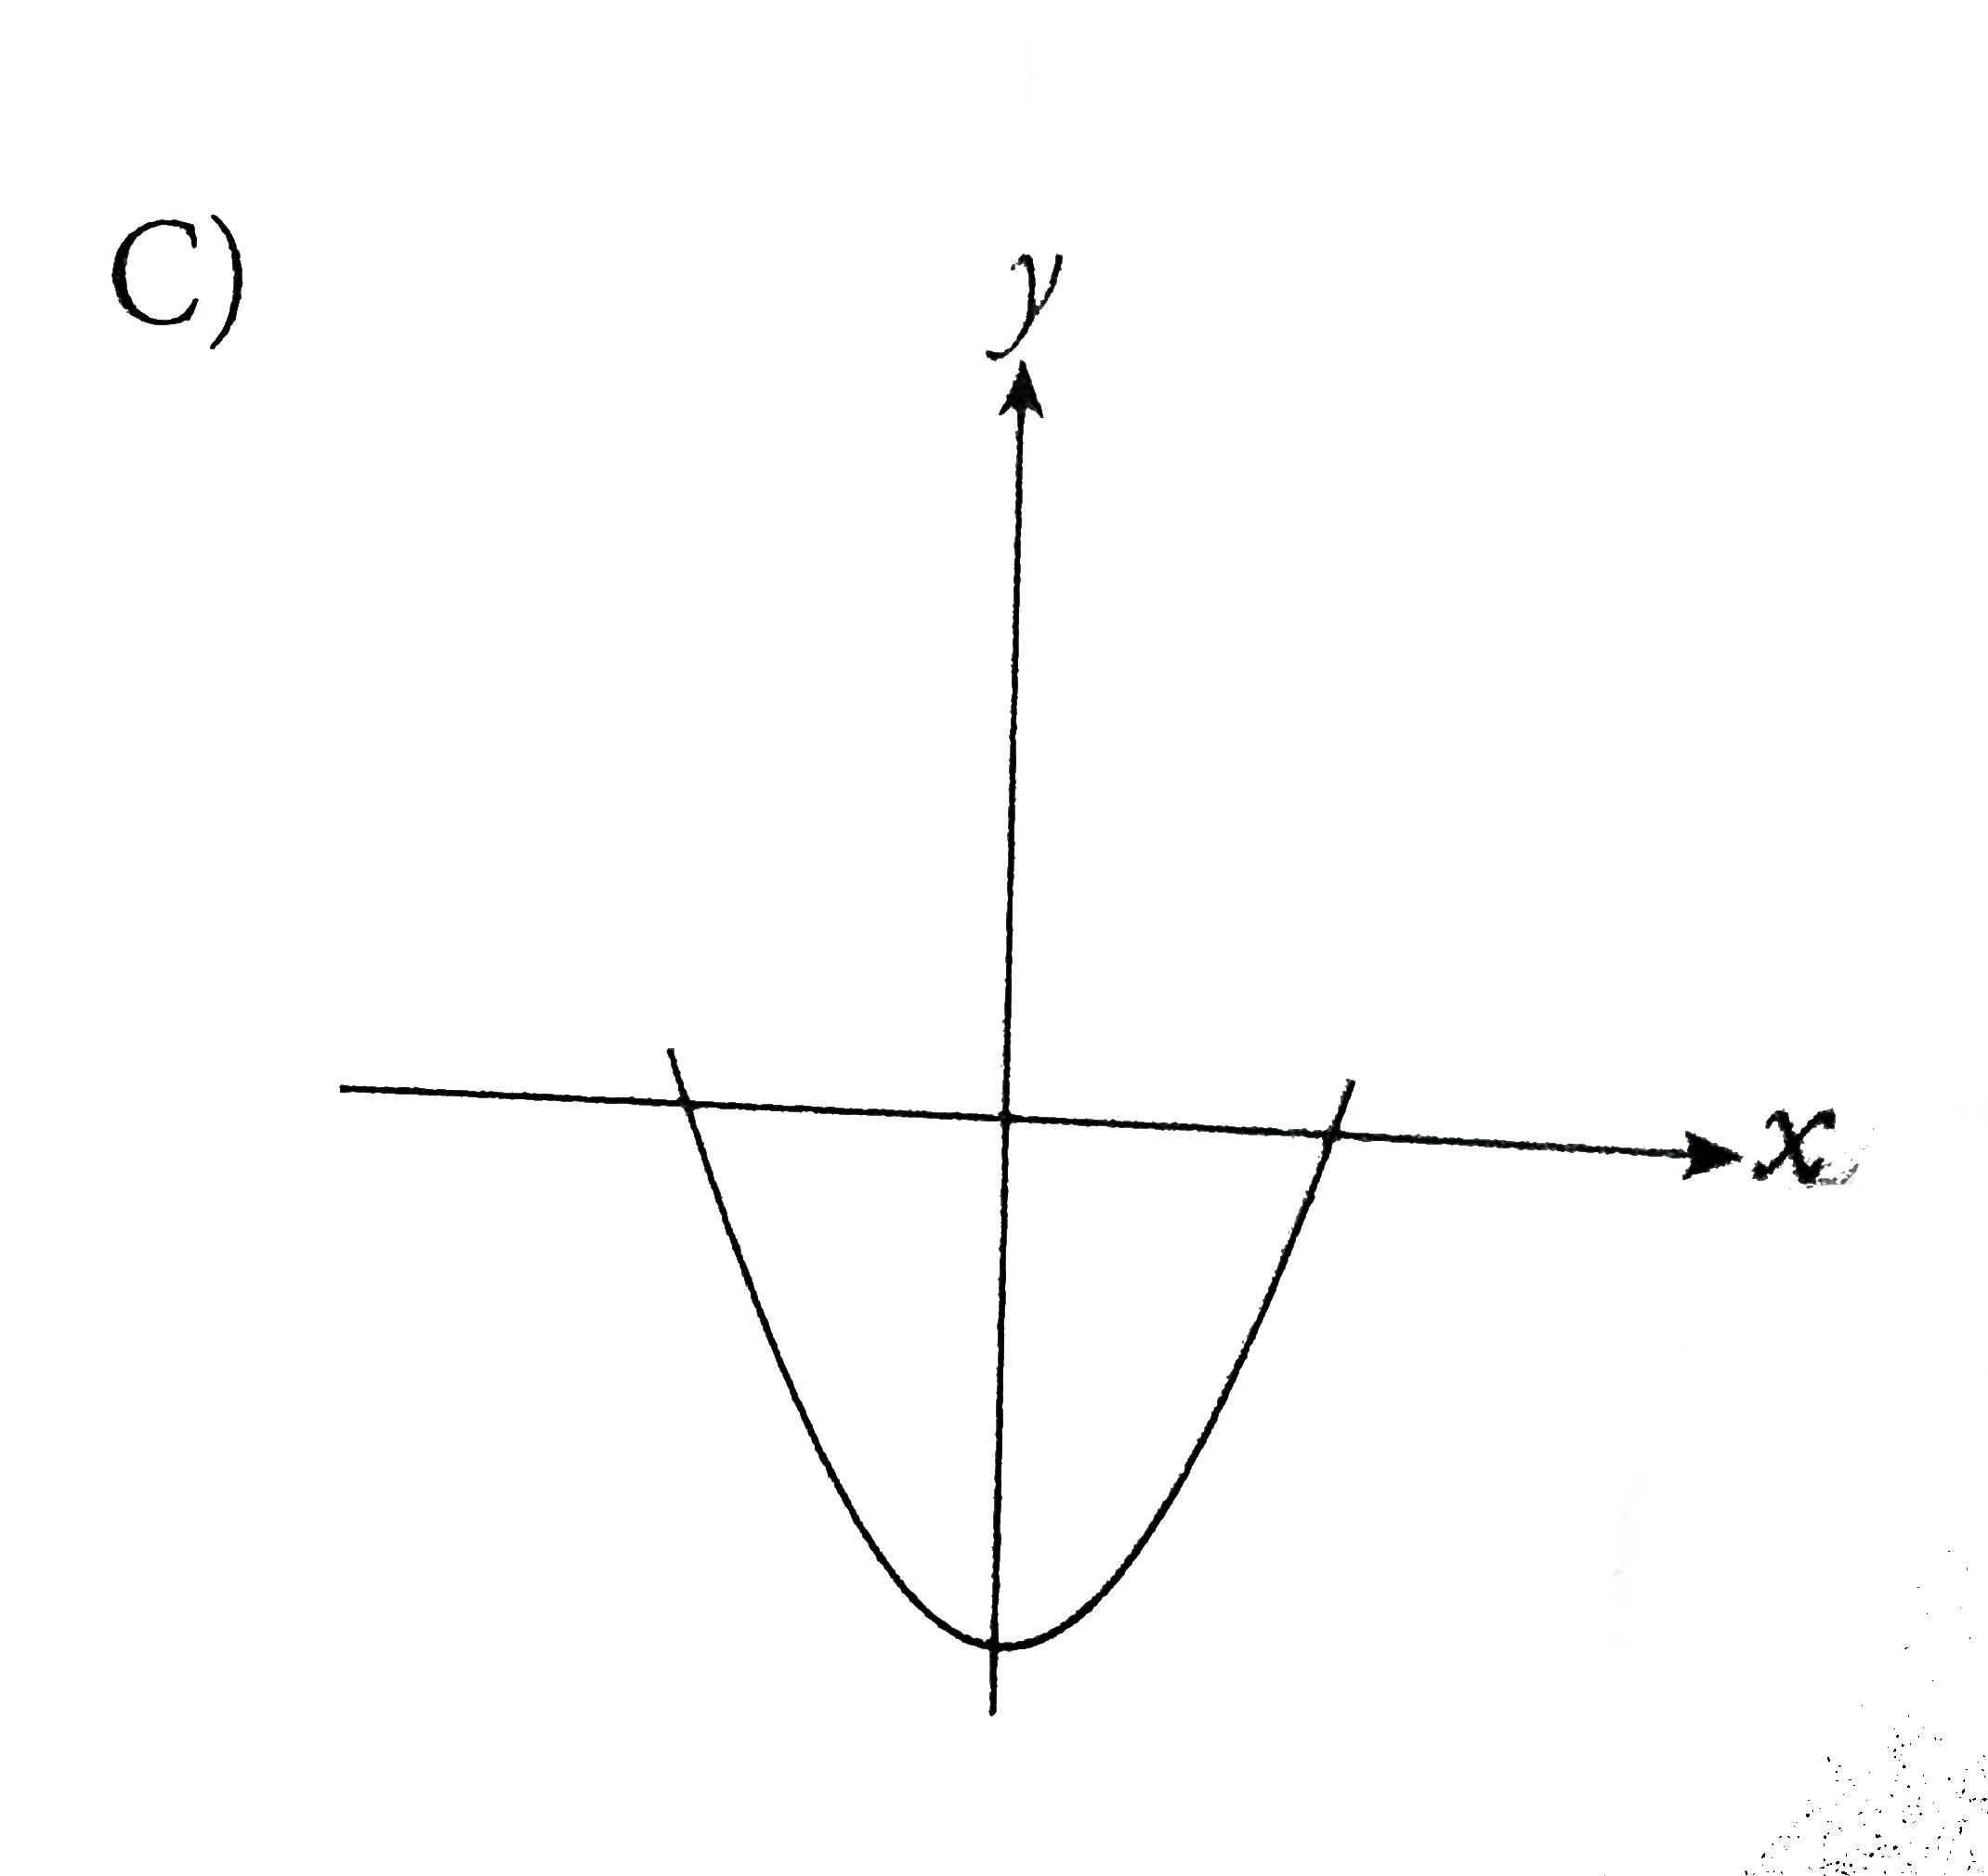 D
D
Which of the following graphs represent function whose derivatives have a maximum in the interval (0,1) ?
View SolutionWhich of the following is correct graph for the reaction?
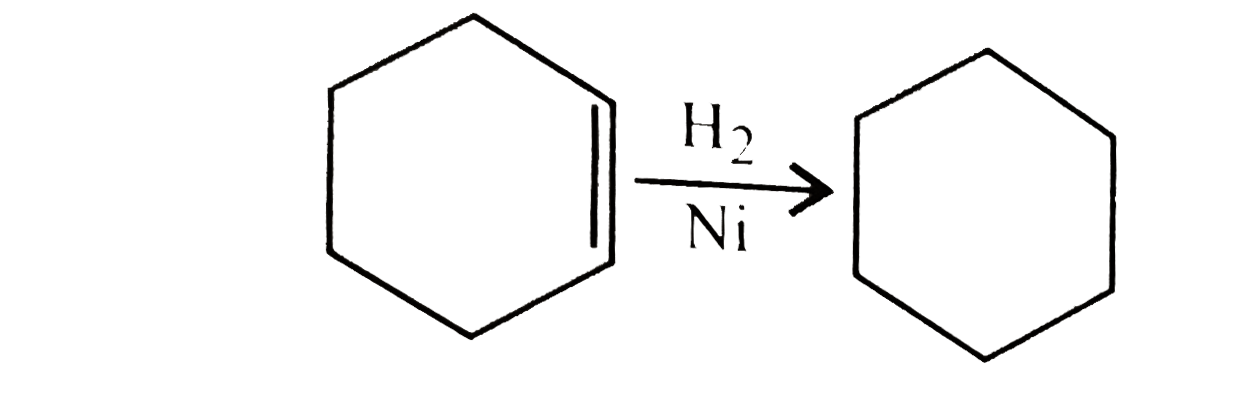
View SolutionThe graph of the function y=f(x). Then which of the following curve represent the graph of the function y=|f(x)|
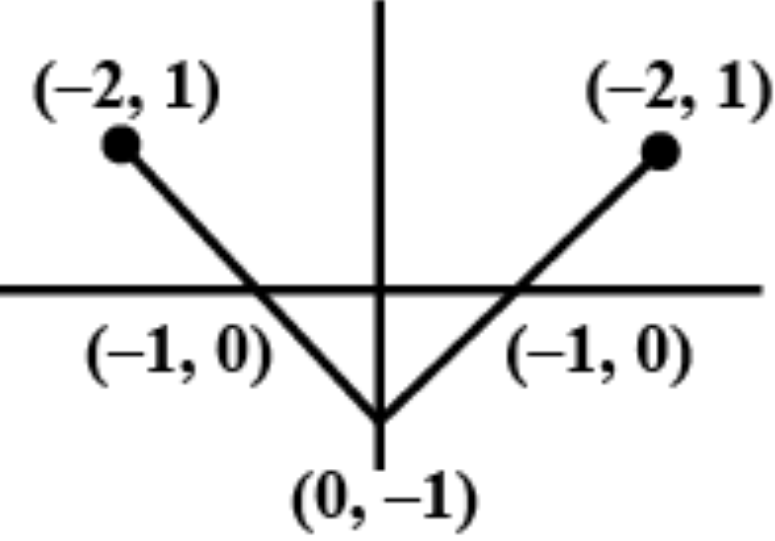
View SolutionWhich of the following graphs could not be the graph of a function?
View SolutionWhich of the following graphs correctly shows variation of coefficient of volume expansion of copper as a function of temperature ?
View Solution