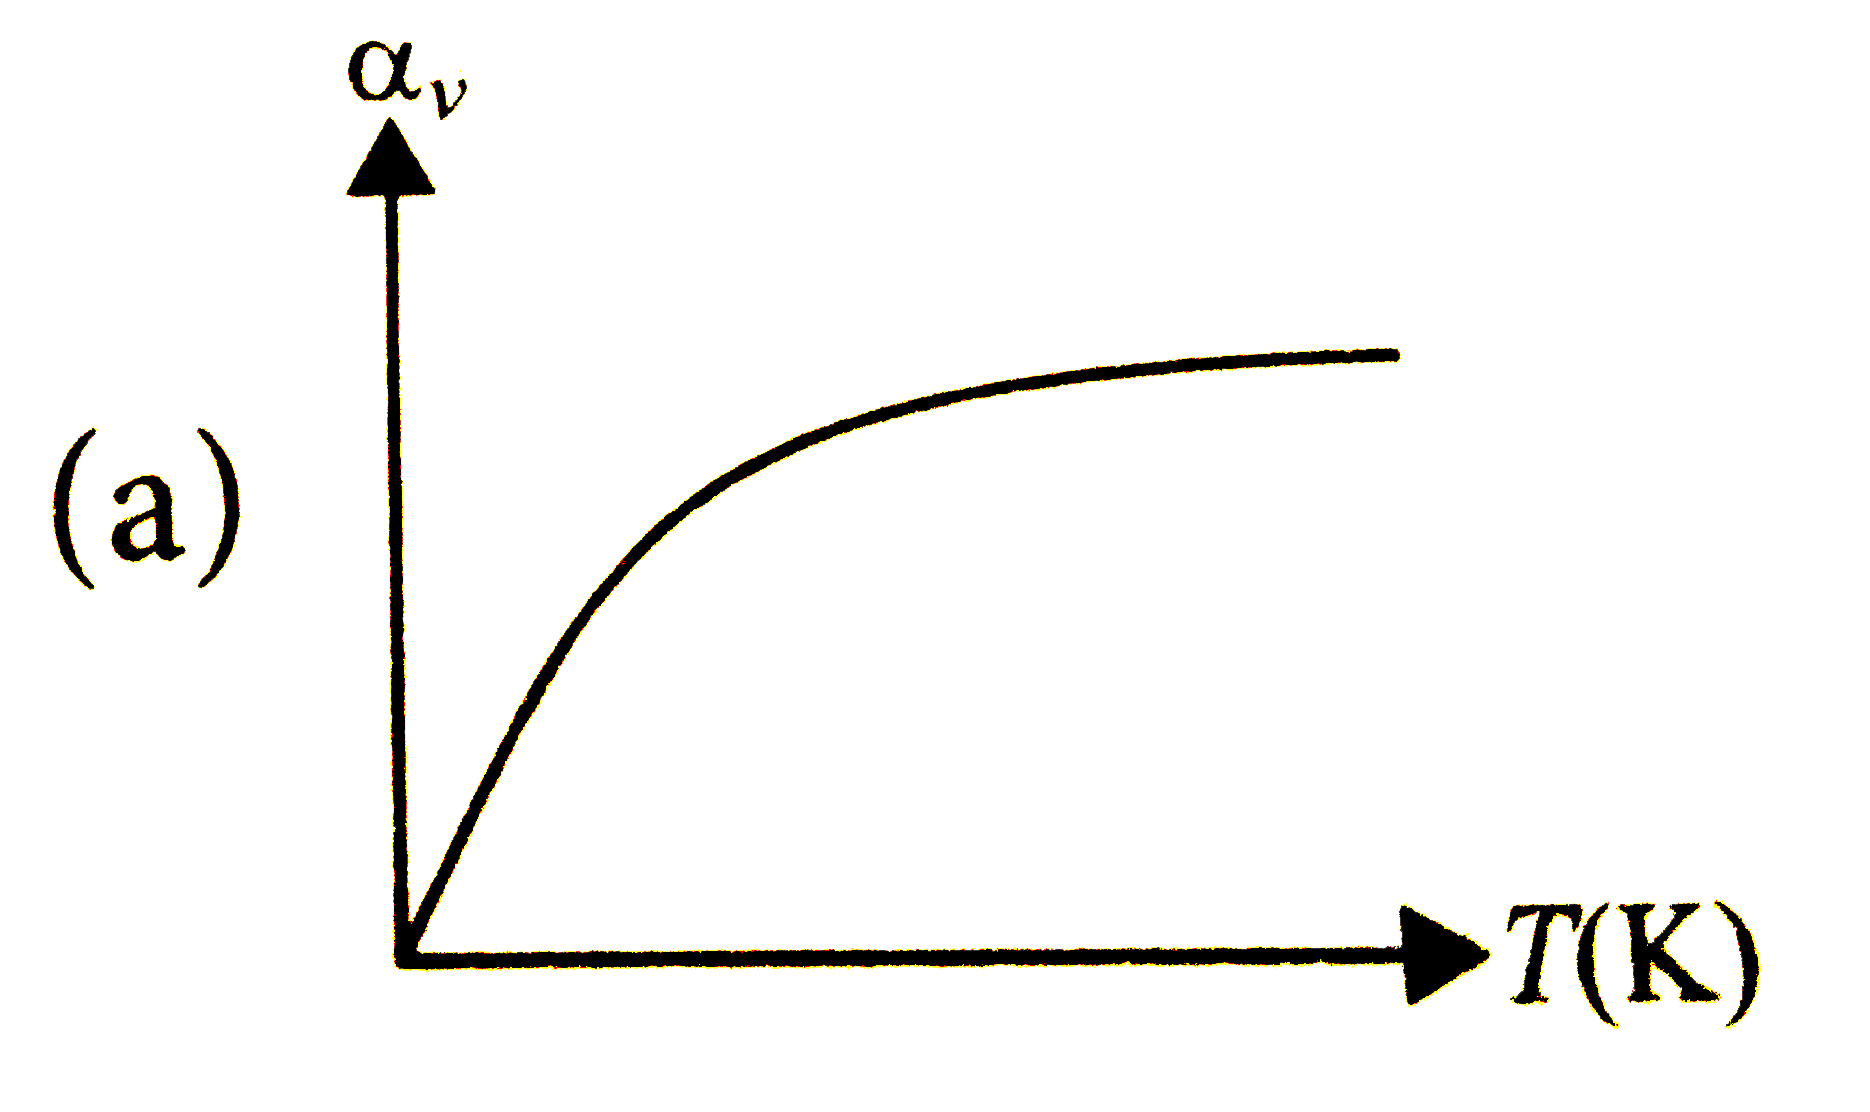
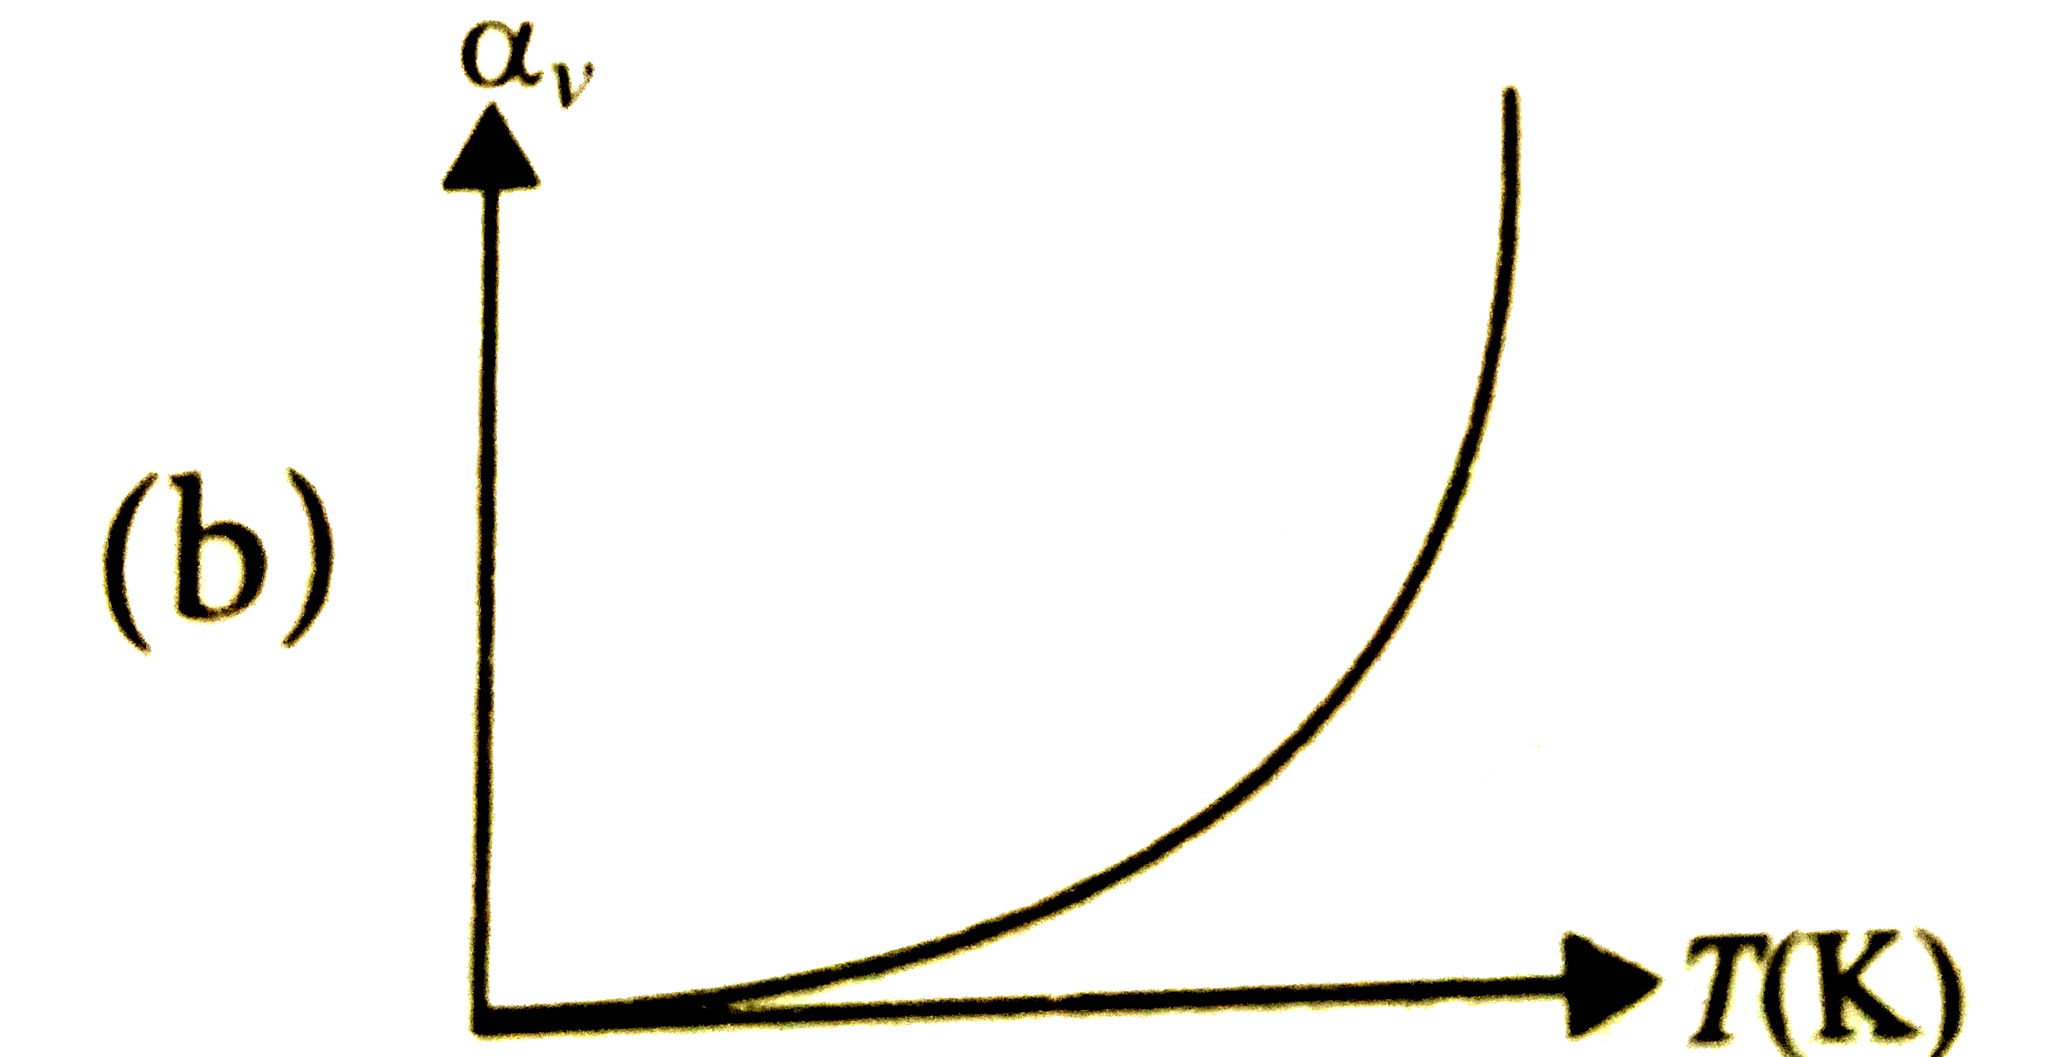
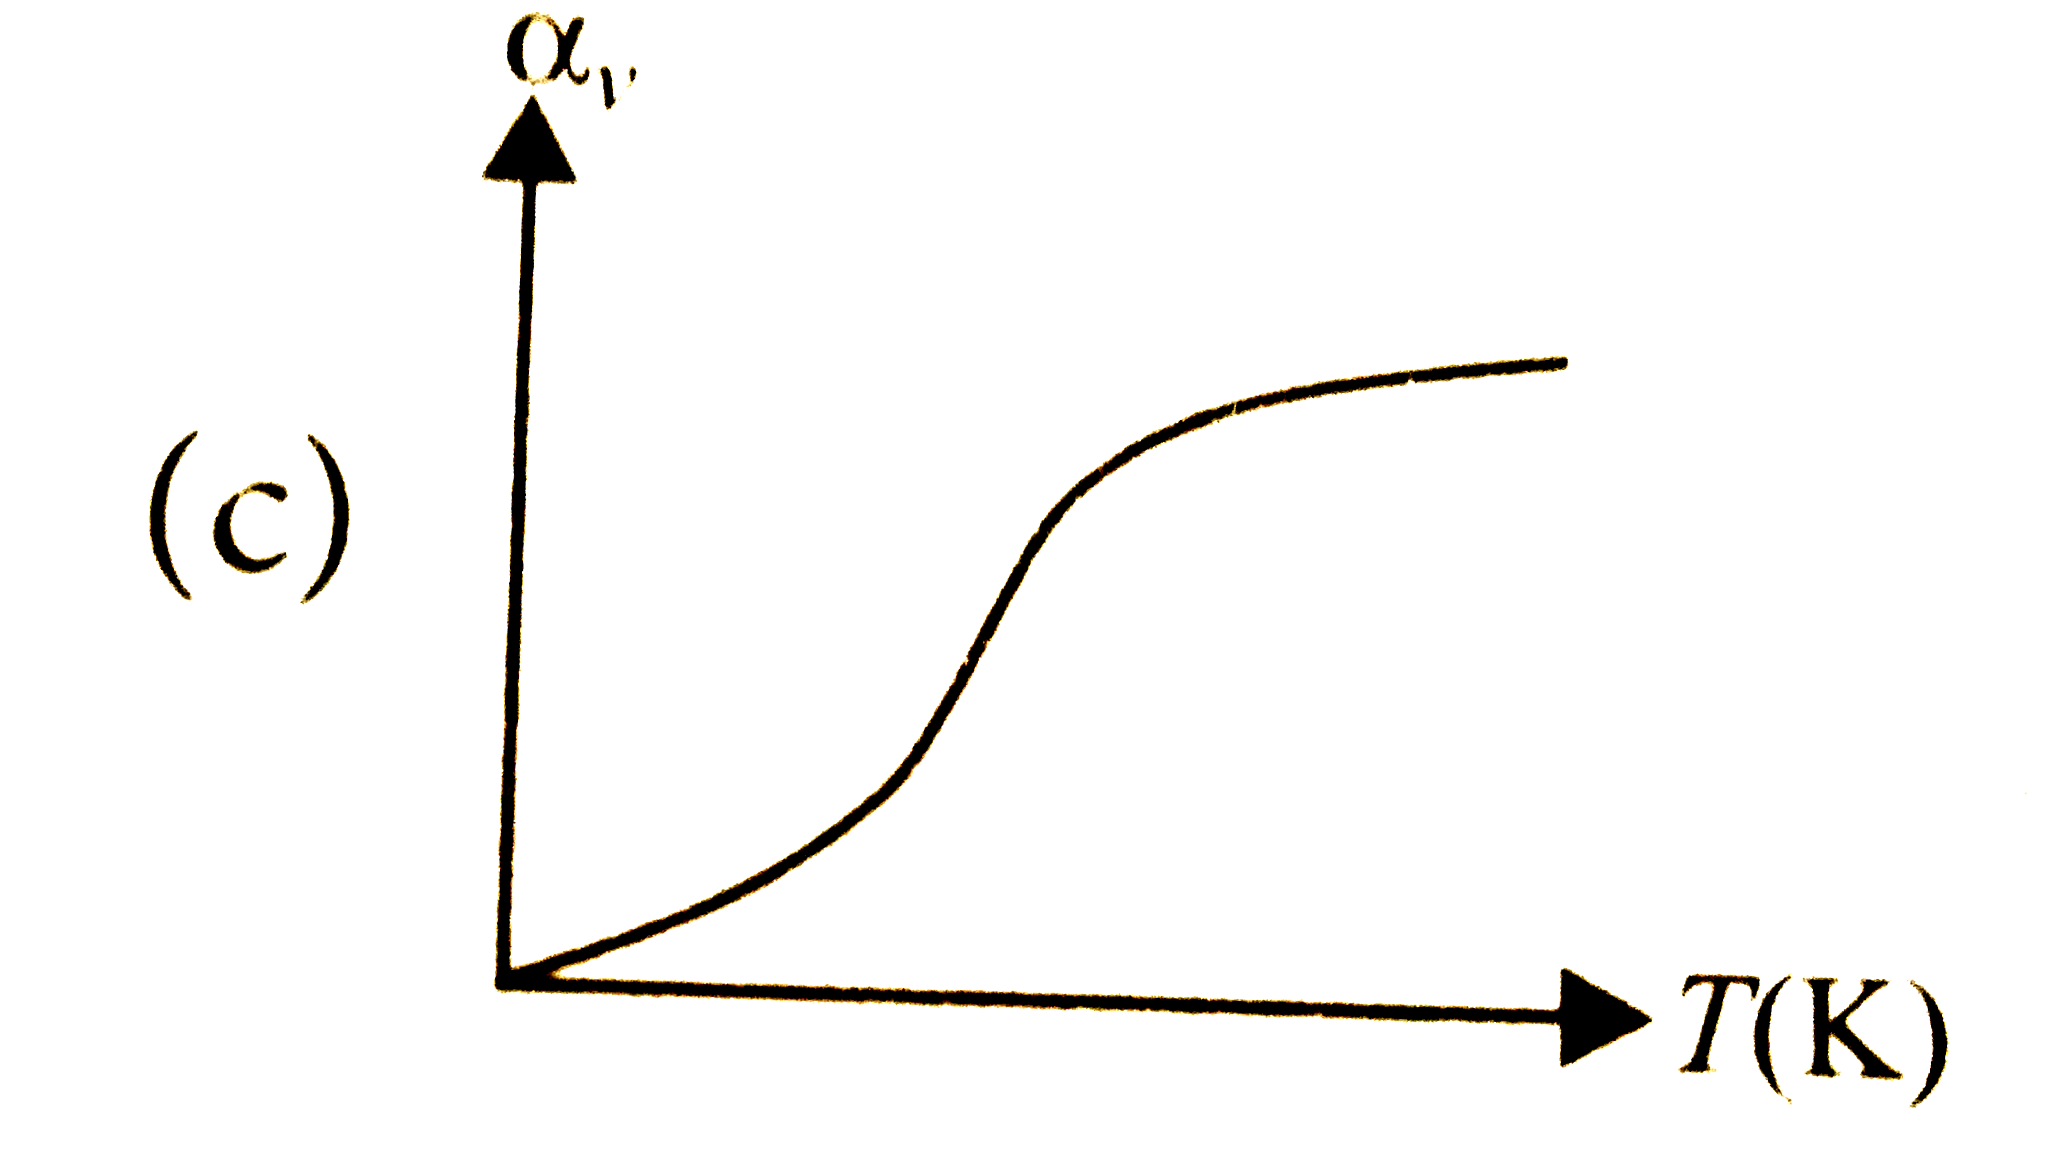
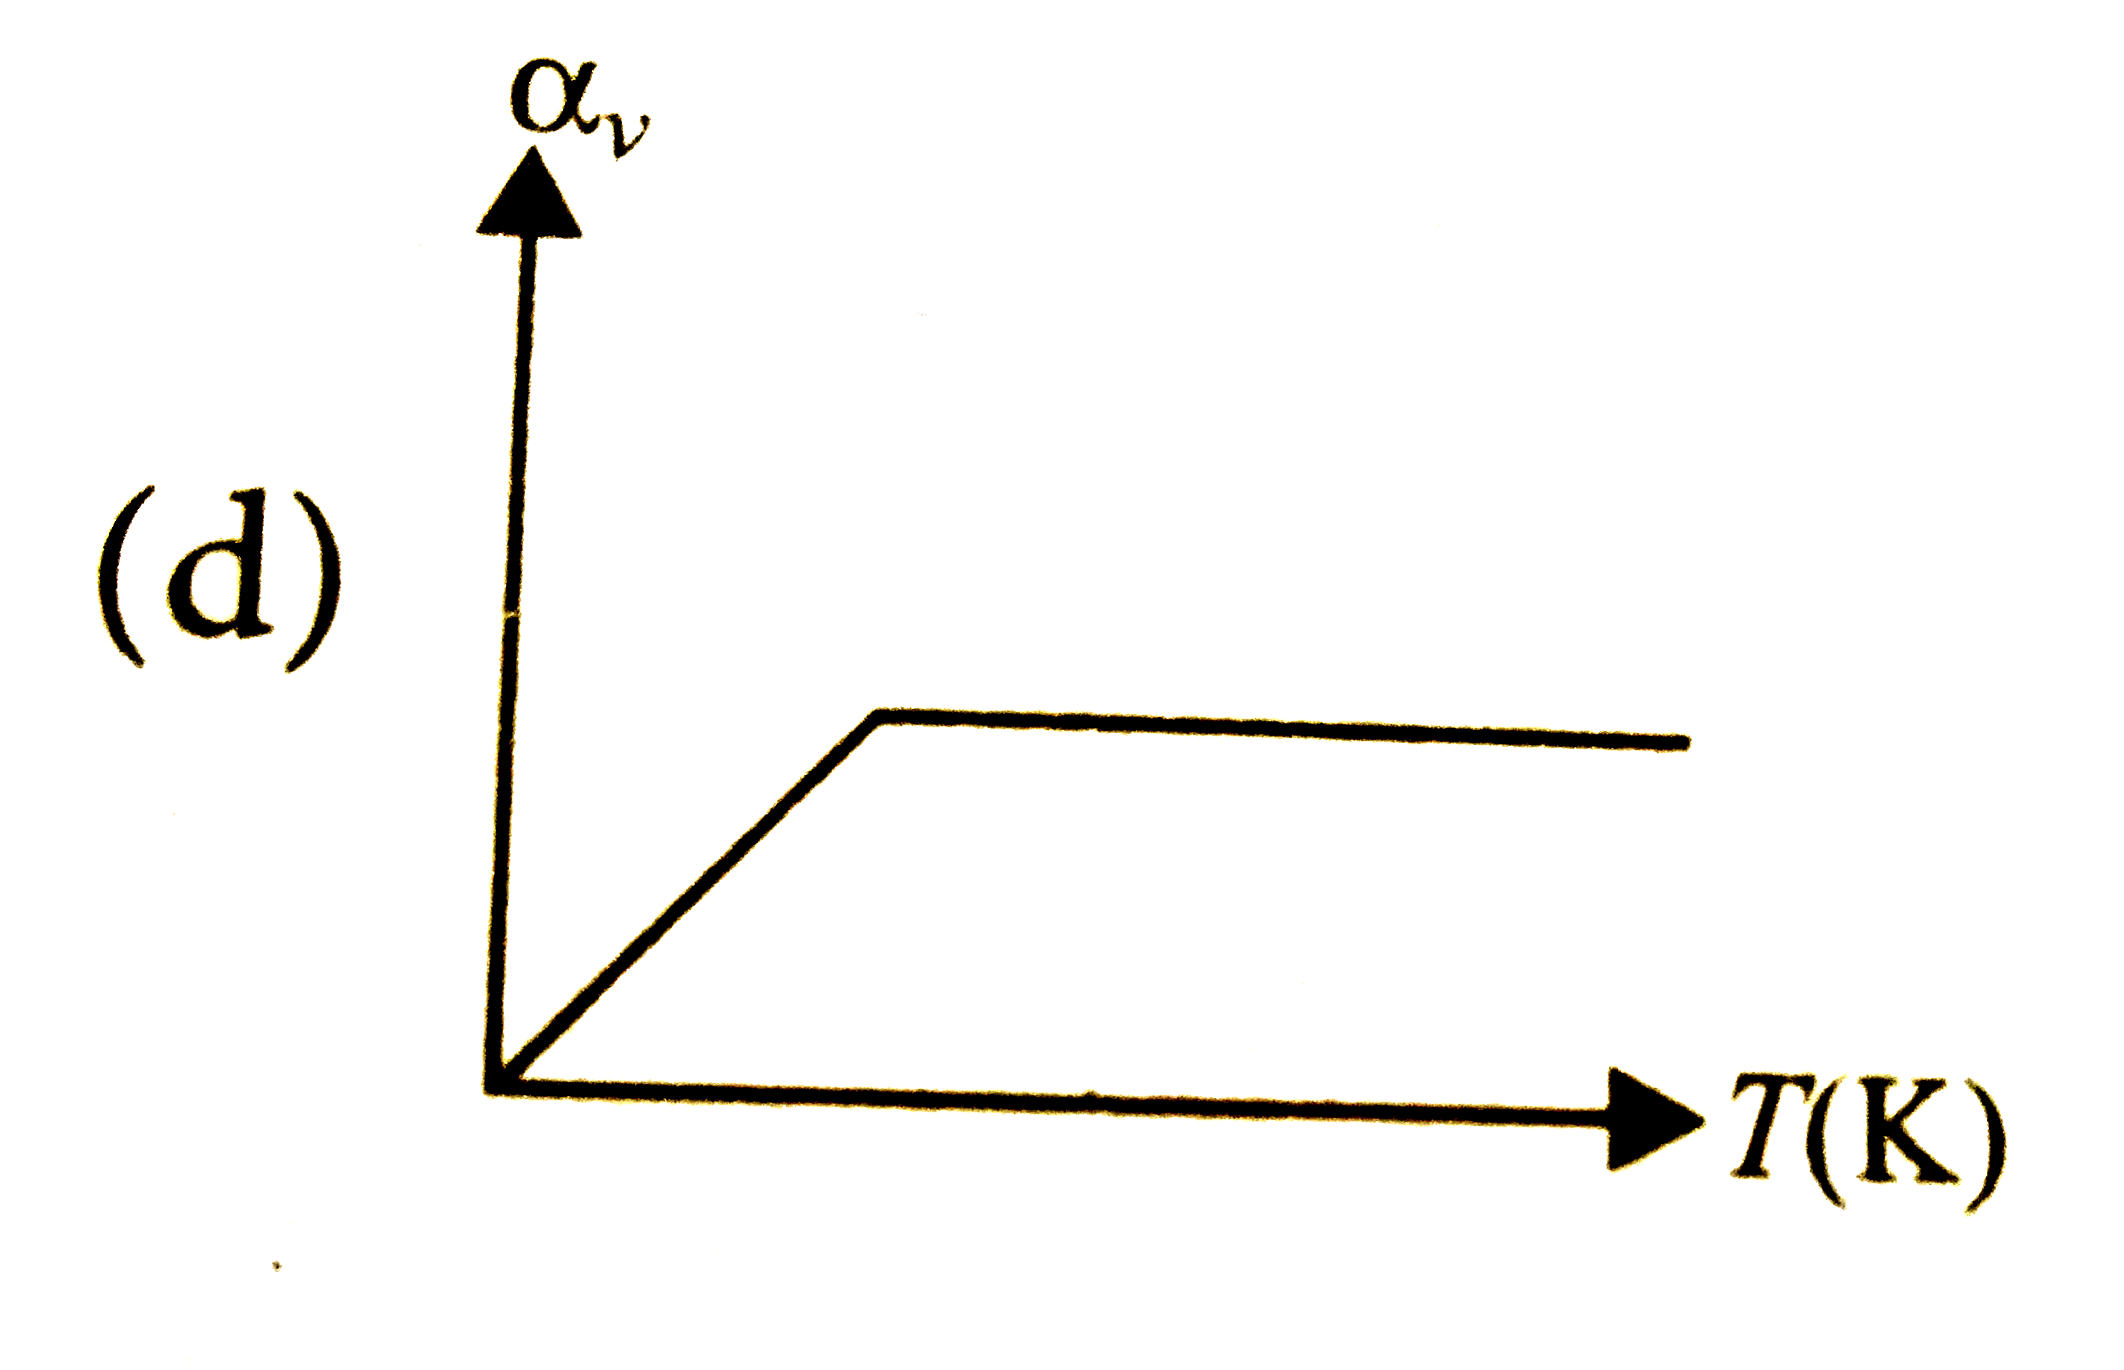
Which of the following graphs correctly shows variation of coefficient of volume expansion of copper as a function of temperature ?
The correct Answer is:C
To solve the problem of determining which graph correctly shows the variation of the coefficient of volume expansion of copper as a function of temperature, we can follow these steps:
Step 1: Understand the Concept of Volume Expansion
The coefficient of volume expansion (β) describes how the volume of a substance changes with temperature. For solids like copper, this coefficient can change with temperature.
Step 2: Analyze the Relationship
The relationship for volume expansion can be expressed as:
ΔVV=βΔT
Where:
- ΔV is the change in volume,
- V is the original volume,
- β is the coefficient of volume expansion,
- ΔT is the change in temperature.
Step 3: Consider the Temperature Dependence
As temperature increases, the coefficient of volume expansion for materials like copper typically increases initially and may reach a point where it becomes relatively constant. This means that the graph will not be a straight line but will show a nonlinear increase initially and then level off.
Step 4: Evaluate the Graph Options
Now we need to evaluate the four graph options given:
1. Option 1: Shows a nonlinear increase but does not level off.
2. Option 2: Also shows a nonlinear increase without leveling off.
3. Option 3: Shows a nonlinear increase initially and then becomes constant after a certain temperature.
4. Option 4: Shows a linear increase, which is incorrect for this scenario.
Step 5: Identify the Correct Graph
From the analysis:
- Option 3 is the correct graph as it accurately represents the behavior of the coefficient of volume expansion of copper, showing an initial nonlinear increase followed by a constant value.
Conclusion
The correct answer is Option 3.
---
The coefficient of volume expansion (β) describes how the volume of a substance changes with temperature. For solids like copper, this coefficient can change with temperature.
The relationship for volume expansion can be expressed as:
ΔVV=βΔT
Where:
- ΔV is the change in volume,
- V is the original volume,
- β is the coefficient of volume expansion,
- ΔT is the change in temperature.
As temperature increases, the coefficient of volume expansion for materials like copper typically increases initially and may reach a point where it becomes relatively constant. This means that the graph will not be a straight line but will show a nonlinear increase initially and then level off.
Now we need to evaluate the four graph options given:
1. Option 1: Shows a nonlinear increase but does not level off.
2. Option 2: Also shows a nonlinear increase without leveling off.
3. Option 3: Shows a nonlinear increase initially and then becomes constant after a certain temperature.
4. Option 4: Shows a linear increase, which is incorrect for this scenario.
From the analysis:
- Option 3 is the correct graph as it accurately represents the behavior of the coefficient of volume expansion of copper, showing an initial nonlinear increase followed by a constant value.
The correct answer is Option 3.
Topper's Solved these Questions
- THERMAL PROPERTIES OF MATTERBOOK - NCERT FINGERTPS ENGLISHCHAPTER - THERMAL PROPERTIES OF MATTEREXERCISE - Specific Heat
5 Videos
- THERMAL PROPERTIES OF MATTERBOOK - NCERT FINGERTPS ENGLISHCHAPTER - THERMAL PROPERTIES OF MATTEREXERCISE - Calorimetery
4 Videos
- THERMAL PROPERTIES OF MATTERBOOK - NCERT FINGERTPS ENGLISHCHAPTER - THERMAL PROPERTIES OF MATTEREXERCISE - Measurement of Temperature
2 Videos
- SYSTEM OF PARTICLES AND ROTATIONAL MOTIONSBOOK - NCERT FINGERTPS ENGLISHCHAPTER - SYSTEM OF PARTICLES AND ROTATIONAL MOTIONSEXERCISE - NCERT Exemplar
8 Videos
- THERMODYNAMICSBOOK - NCERT FINGERTPS ENGLISHCHAPTER - THERMODYNAMICSEXERCISE - Assertion And Reason
15 Videos
Similar Questions
Knowledge Check
Which of the following graphs is NOT a function ?
A B
B C
C D
D
Which of the following graph shows the variationi of density of water increase in temperature ?
A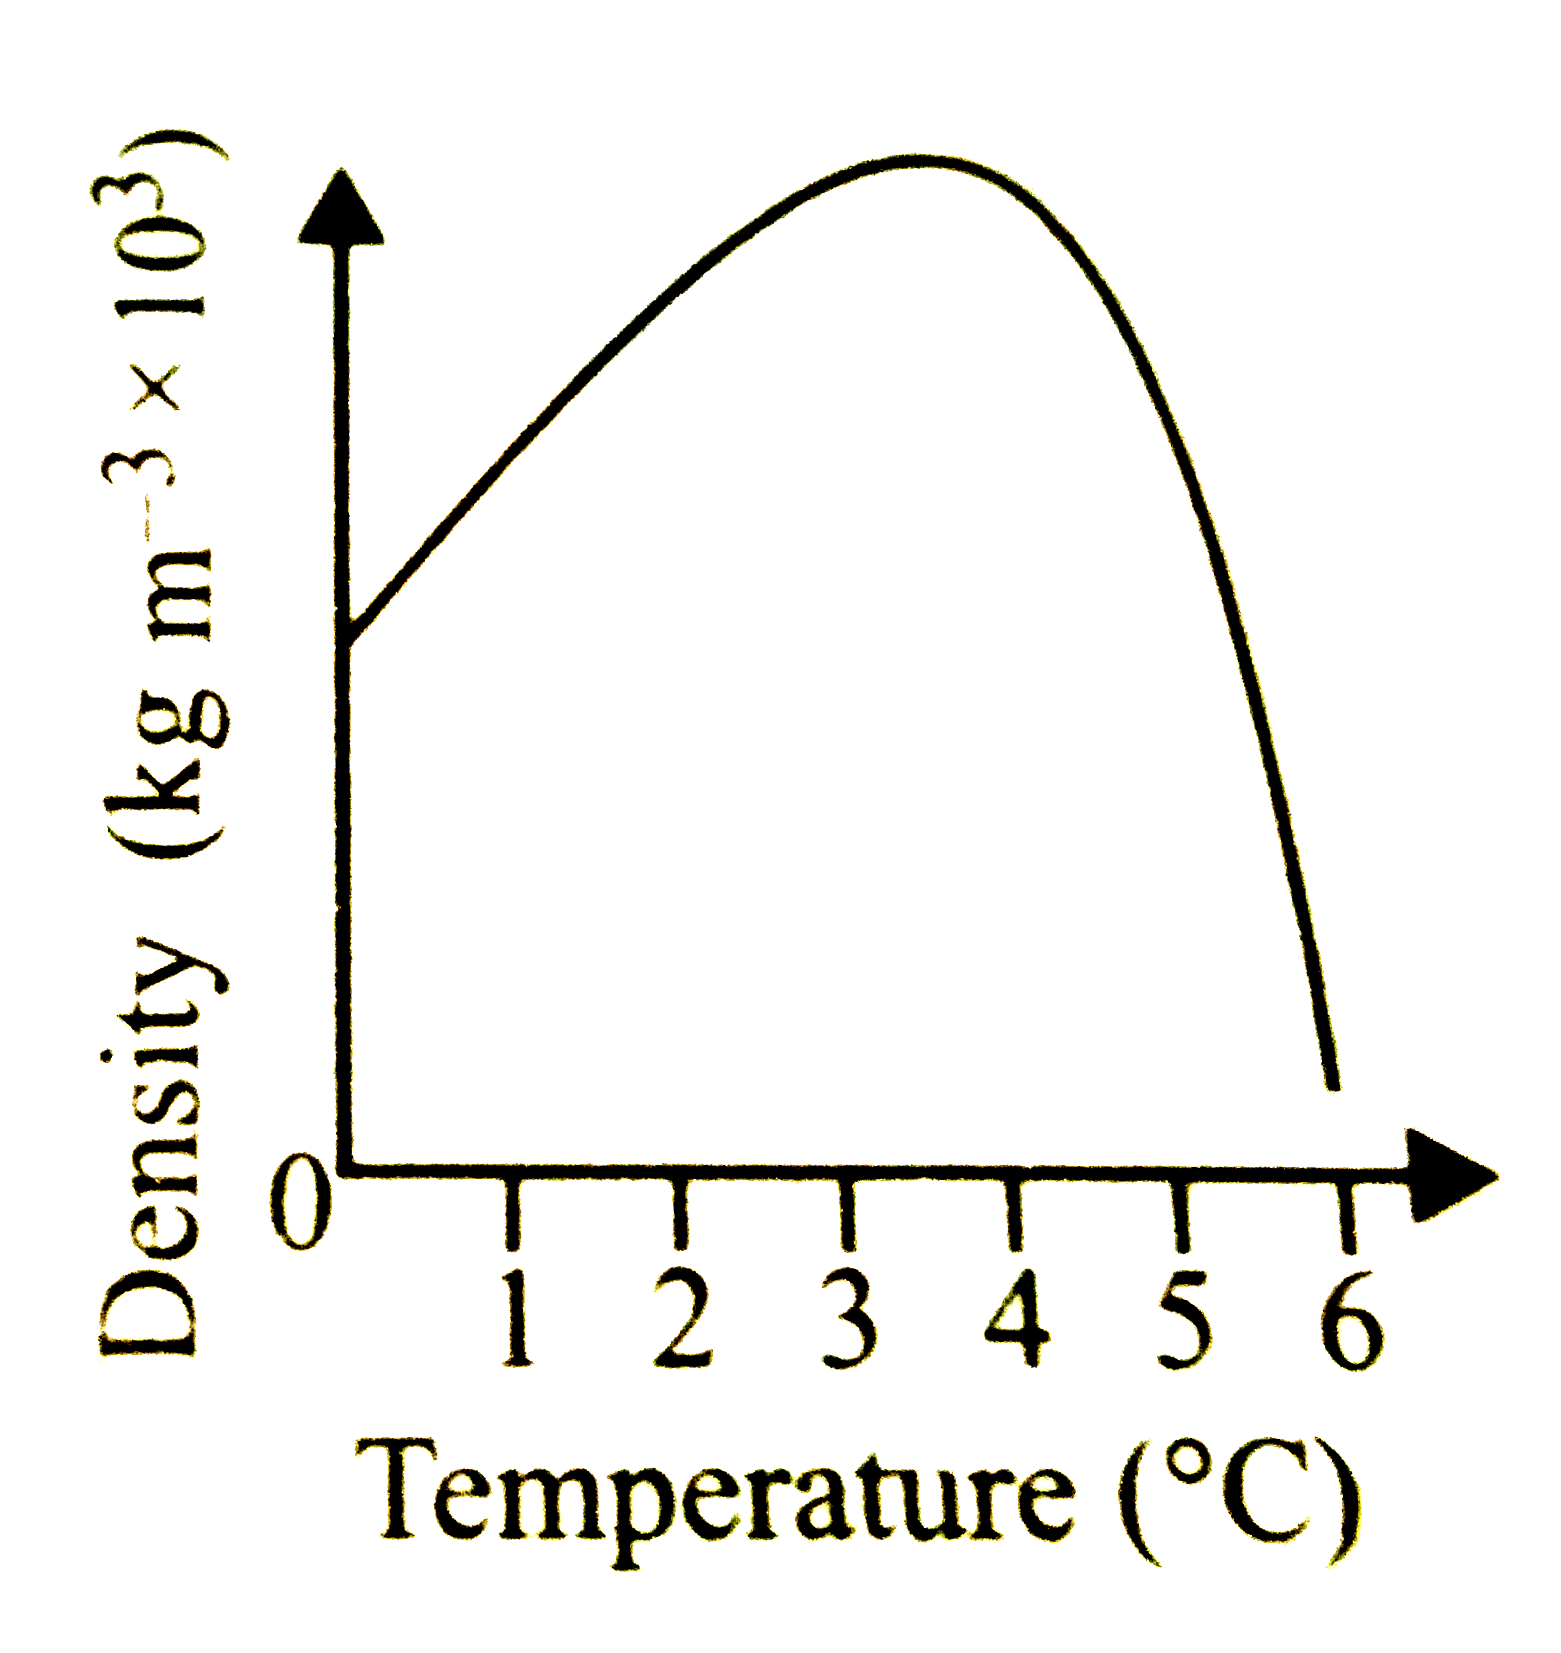 B
B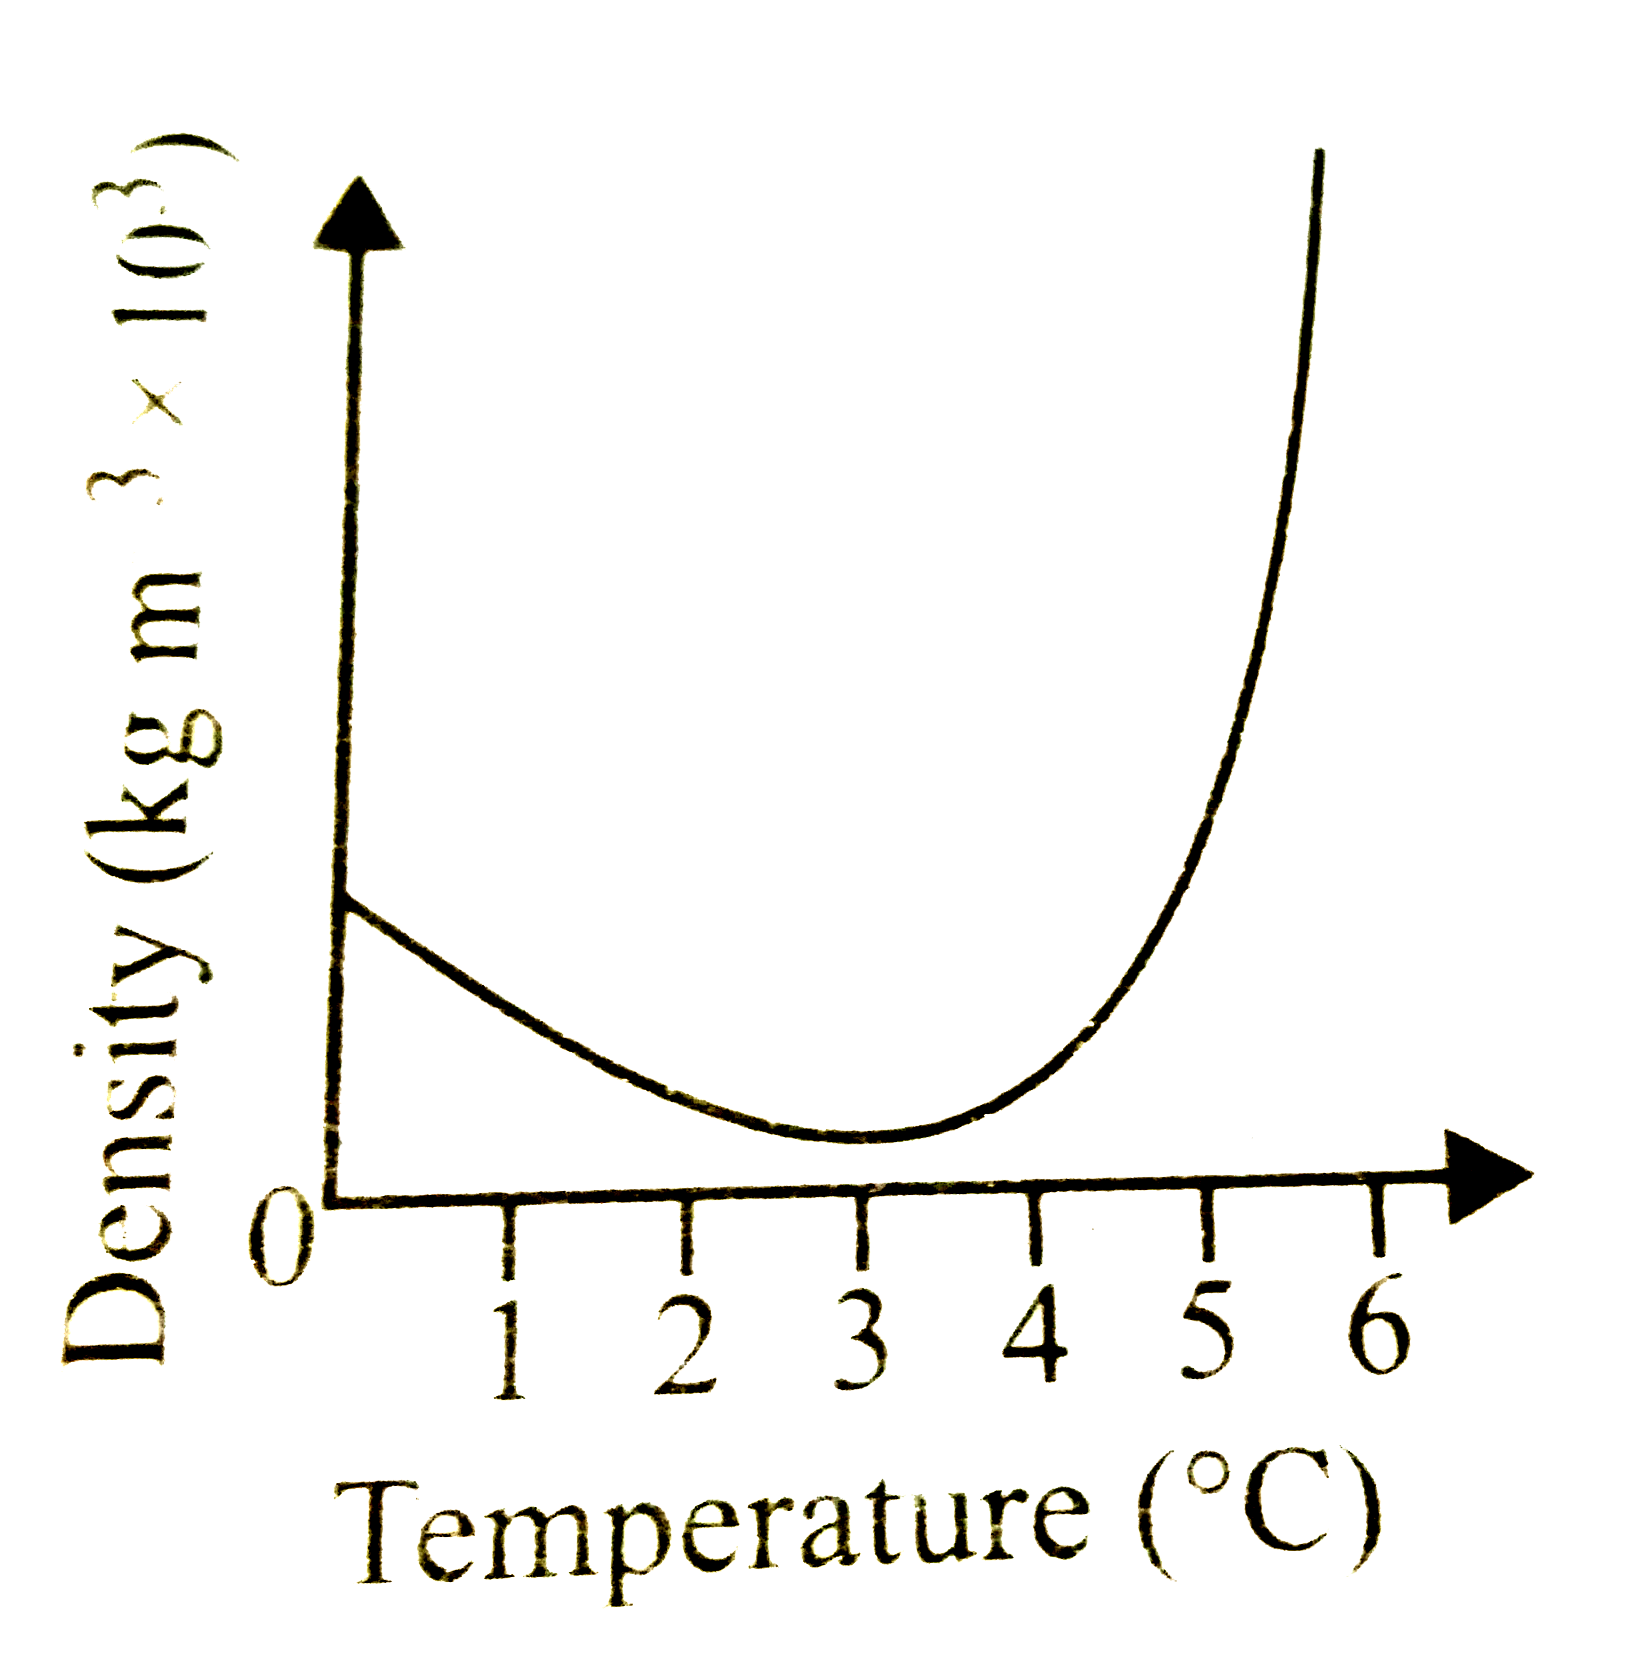 C
C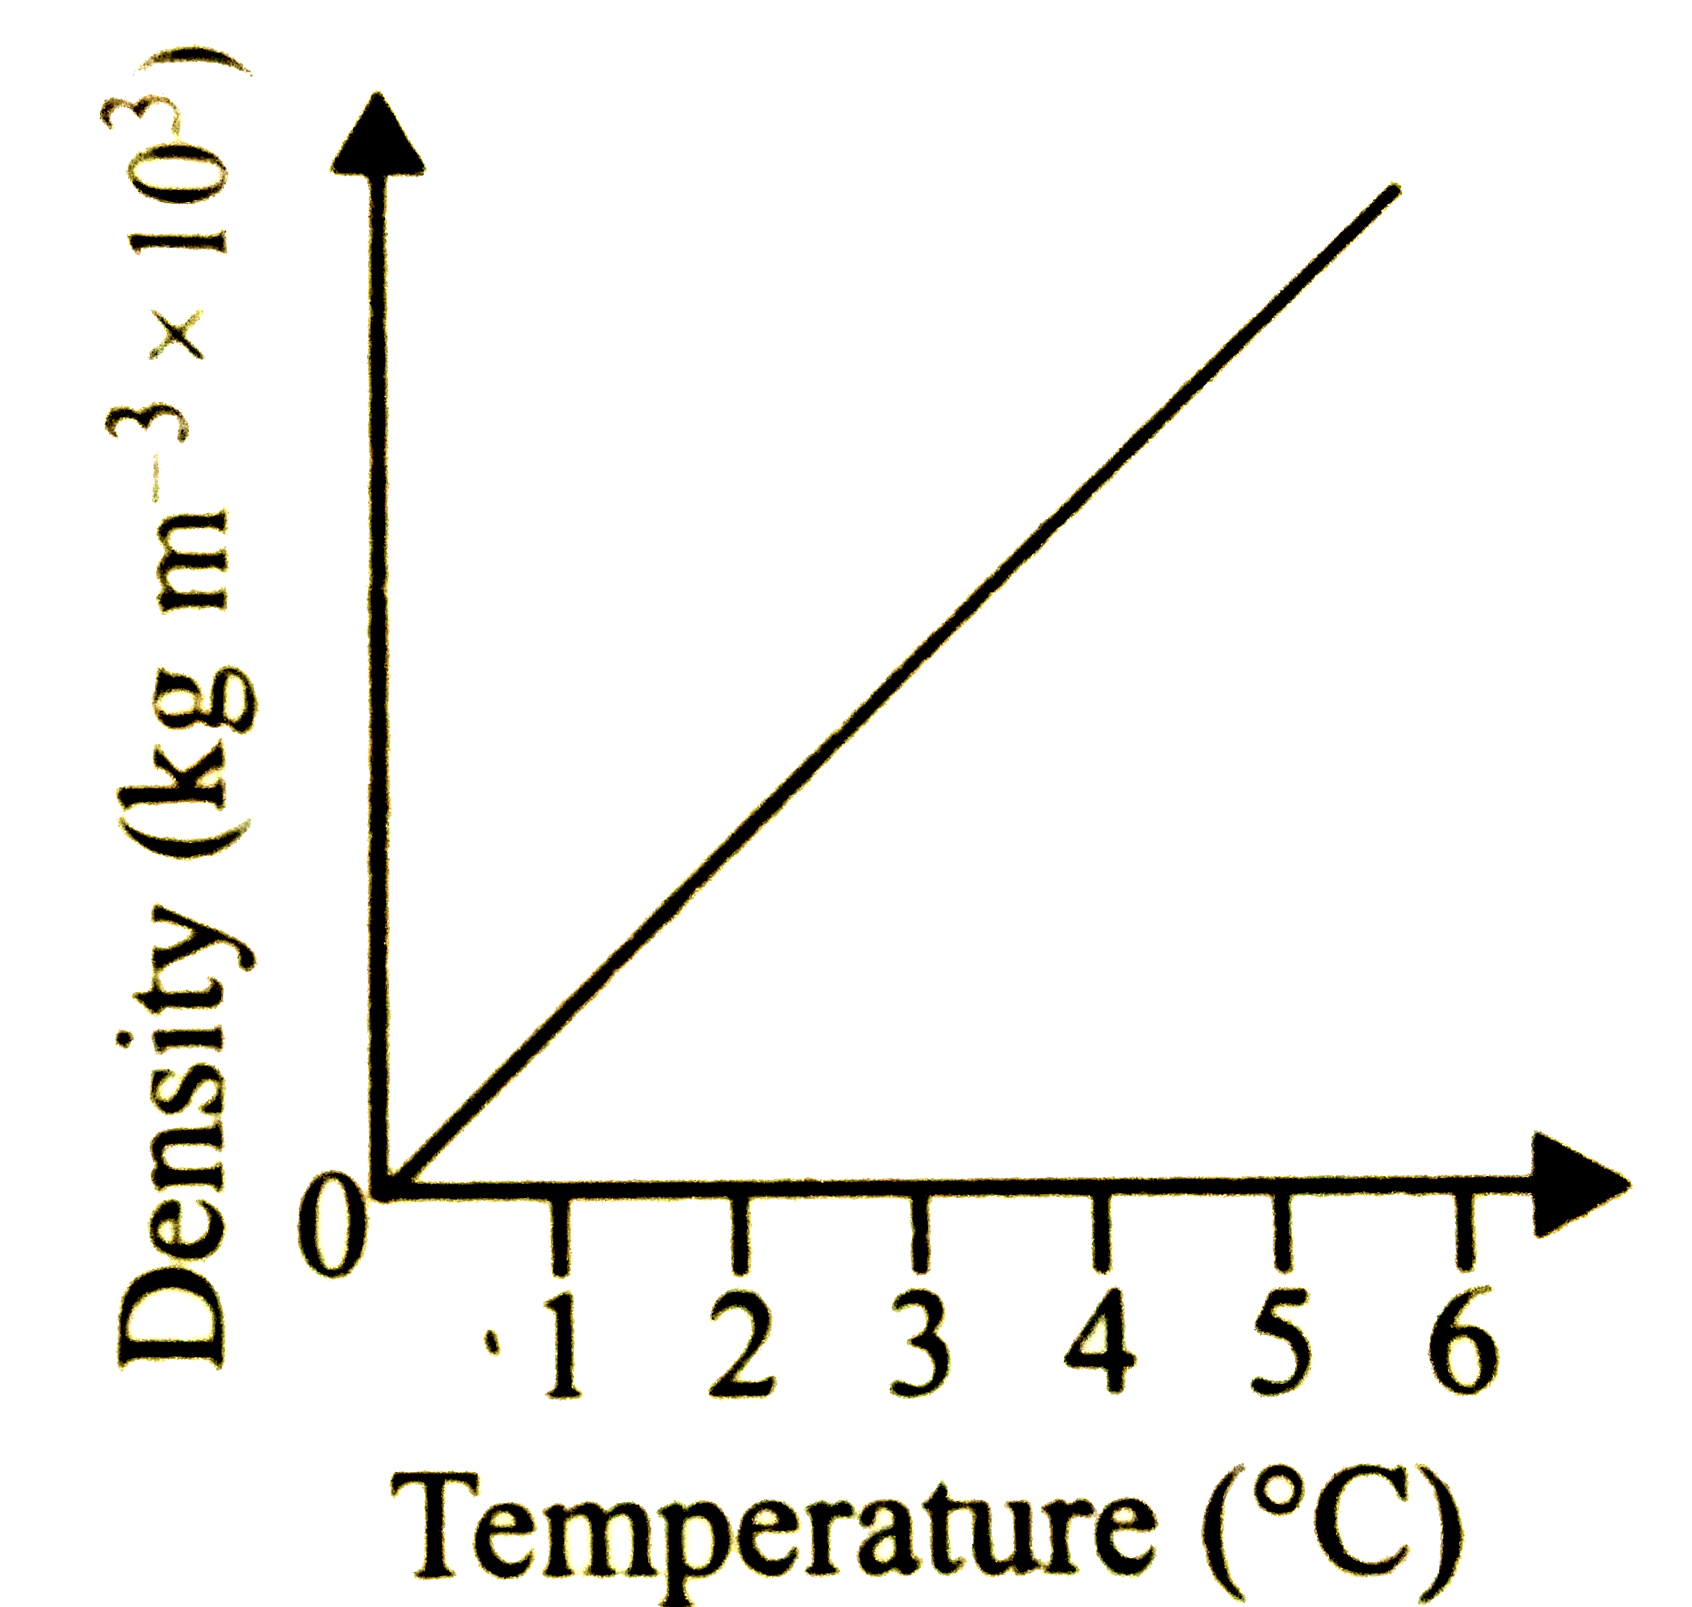 D
D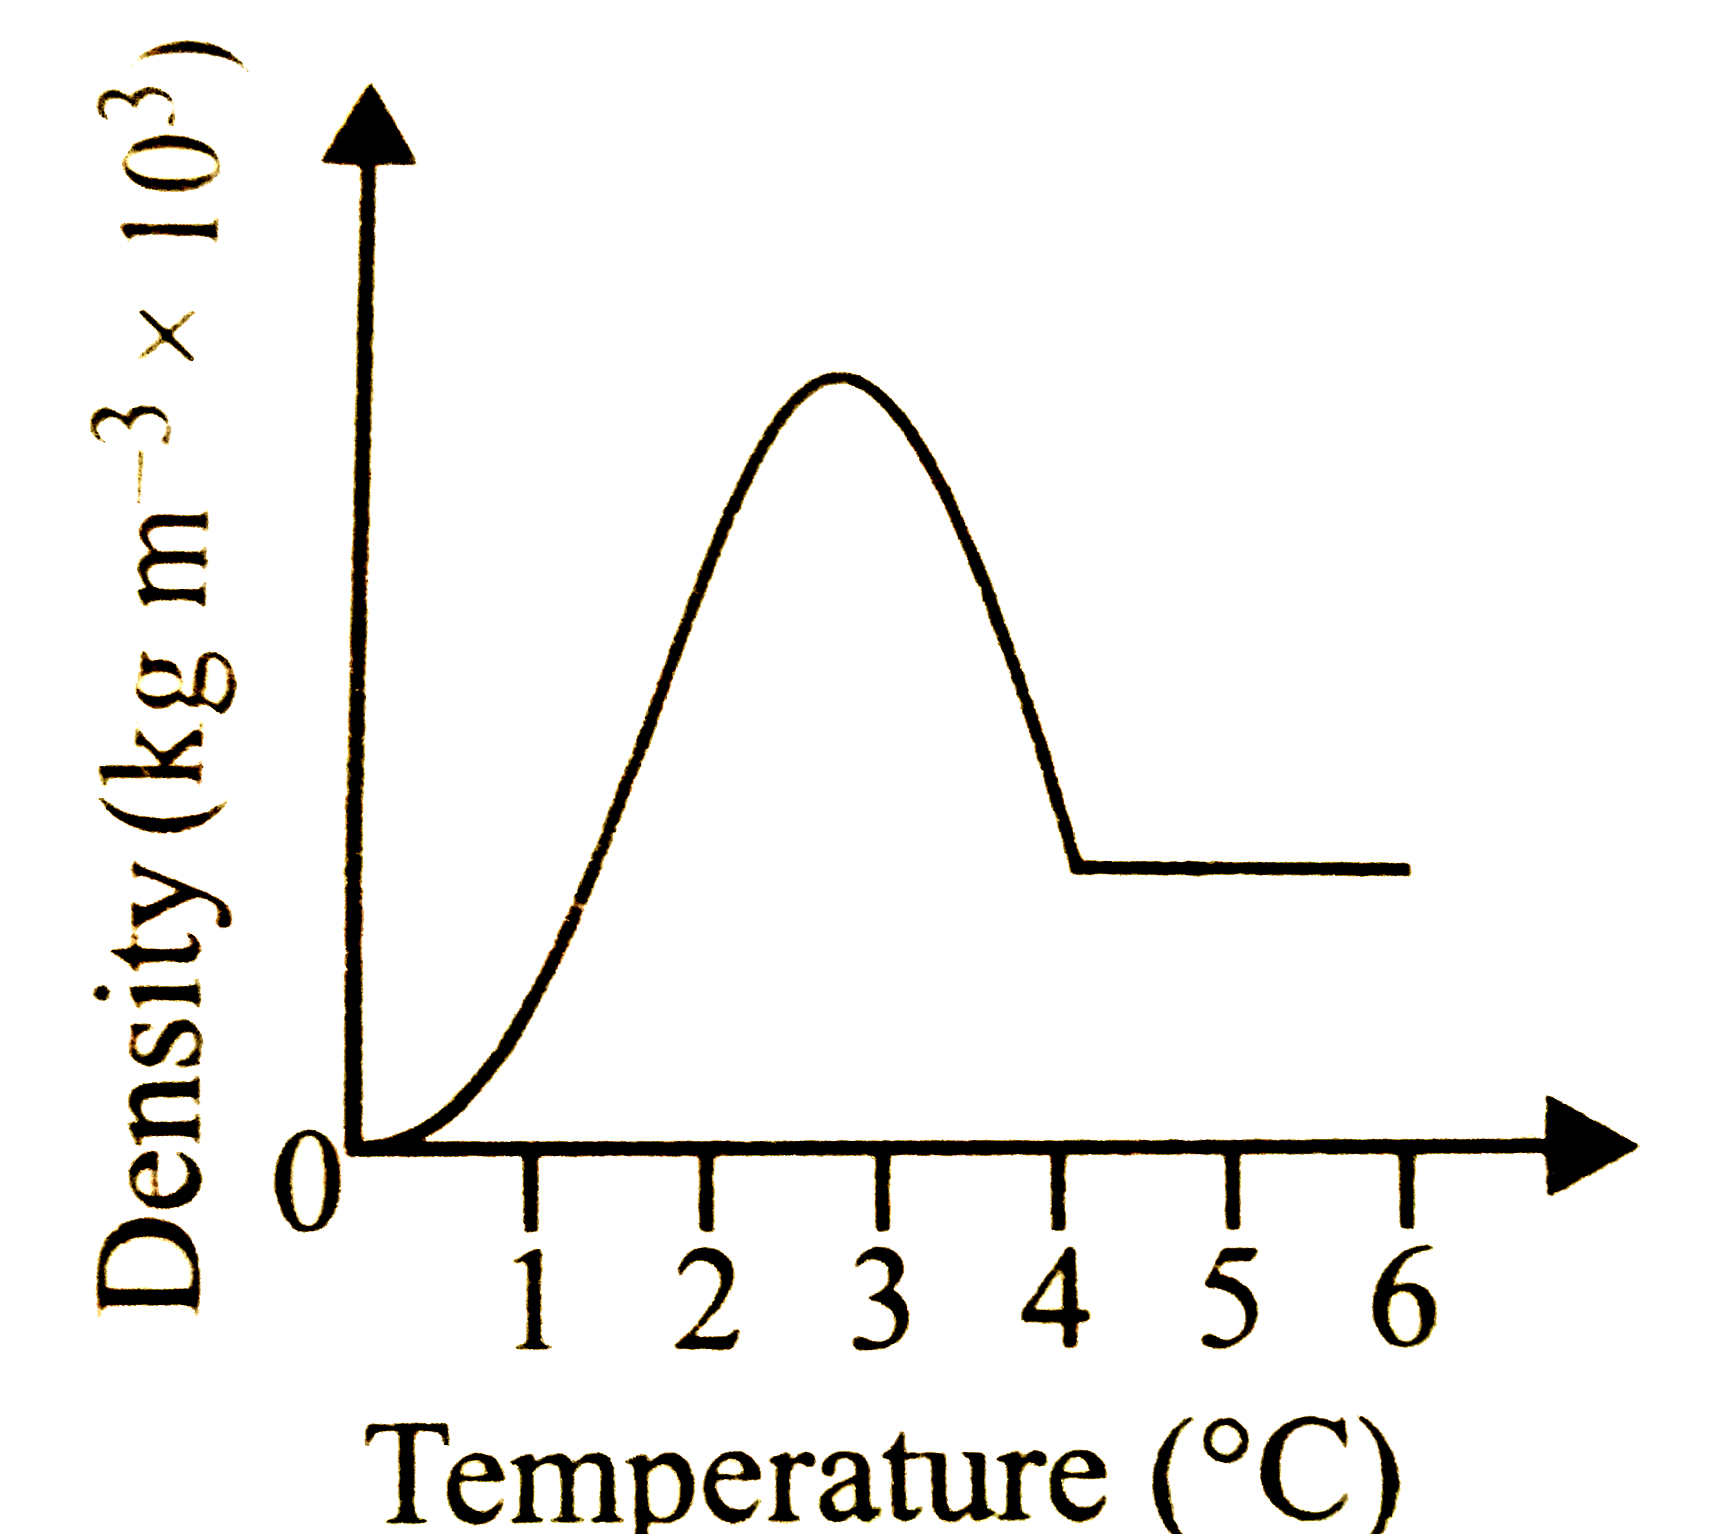
Mercury has a small coefficient of volume expansion.
View SolutionWhich of the following diagram correctly represents the variation of internal energy (U) of gas under expansion at constant temperature.
View SolutionShow variation of resistivity of copper as a function of temperature in a graph.
View SolutionWhich of the following graphs correctly represents the variation of β=−dV/dPV
with P for an ideal gas at constant temperature?
View SolutionWhich of the following graphs correctly represents the variation of β=−dV/dPV
with P for an ideal gas at constant temperature?
View SolutionWhich one of the following shows crossing over and variations
View Solution

