Which of the following graphs cannot be a time temperature graph?


The correct Answer is:B
To determine which of the given graphs cannot be a time-temperature graph, we need to analyze the characteristics of time and temperature in such graphs.
1. Understanding Time-Temperature Graphs:
- A time-temperature graph plots time on the x-axis and temperature on the y-axis.
- Time is always increasing; it cannot decrease or remain constant over a period.
2. Analyzing the Options:
- We need to examine each option to see if any graph shows time remaining constant or decreasing.
3. Option 1:
- In this graph, time is increasing, and temperature is also increasing.
- This is a valid scenario as both time and temperature can increase.
4. Option 2:
- In this graph, time is increasing, but at a certain point, the temperature remains constant (flat line).
- This means that for a period of time, the temperature does not change, which is possible. Thus, this graph is valid.
5. Option 3:
- In this graph, time is increasing, and the temperature is decreasing.
- This is also a valid scenario as time can continue to increase while temperature drops.
6. Identifying the Invalid Graph:
- If any graph shows time remaining constant (a flat line on the time axis), it cannot be a valid time-temperature graph.
- If we find a graph where time does not increase (flat line), that graph is invalid.
7. Conclusion:
- After analyzing the options, we find that Option 2 is the graph where time appears to stop (constant), making it the invalid time-temperature graph.
Final Answer:
- The graph that cannot be a time-temperature graph is Option 2.
- A time-temperature graph plots time on the x-axis and temperature on the y-axis.
- Time is always increasing; it cannot decrease or remain constant over a period.
- We need to examine each option to see if any graph shows time remaining constant or decreasing.
- In this graph, time is increasing, and temperature is also increasing.
- This is a valid scenario as both time and temperature can increase.
- In this graph, time is increasing, but at a certain point, the temperature remains constant (flat line).
- This means that for a period of time, the temperature does not change, which is possible. Thus, this graph is valid.
- In this graph, time is increasing, and the temperature is decreasing.
- This is also a valid scenario as time can continue to increase while temperature drops.
- If any graph shows time remaining constant (a flat line on the time axis), it cannot be a valid time-temperature graph.
- If we find a graph where time does not increase (flat line), that graph is invalid.
- After analyzing the options, we find that Option 2 is the graph where time appears to stop (constant), making it the invalid time-temperature graph.
- The graph that cannot be a time-temperature graph is Option 2.
Topper's Solved these Questions
- BOOK - SCIENCE OLYMPIAD FOUNDATION CHAPTER - IMO QUESTION PAPER 2018-19 SET- AEXERCISE - Everyday Mathematics10videos
IMO QUESTION PAPER 2018-19 SET- A
- BOOK - SCIENCE OLYMPIAD FOUNDATION CHAPTER - IMO QUESTION PAPER 2018-19 SET- AEXERCISE - Achievers Section5videos
IMO QUESTION PAPER 2018-19 SET- A
- BOOK - SCIENCE OLYMPIAD FOUNDATION CHAPTER - IMO QUESTION PAPER 2018-19 SET -B EXERCISE - ACHIEVERS SECTION5videos
IMO QUESTION PAPER 2018-19 SET -B
- BOOK - SCIENCE OLYMPIAD FOUNDATION CHAPTER - IMO QUESTION PAPER 2019-20 SET AEXERCISE - Achievers Section5videos
IMO QUESTION PAPER 2019-20 SET A
Similar Questions
Knowledge Check
- Question 1 - Select One
Which of the following graphs represents the position time-graph of a particle moving with negative velocity?
A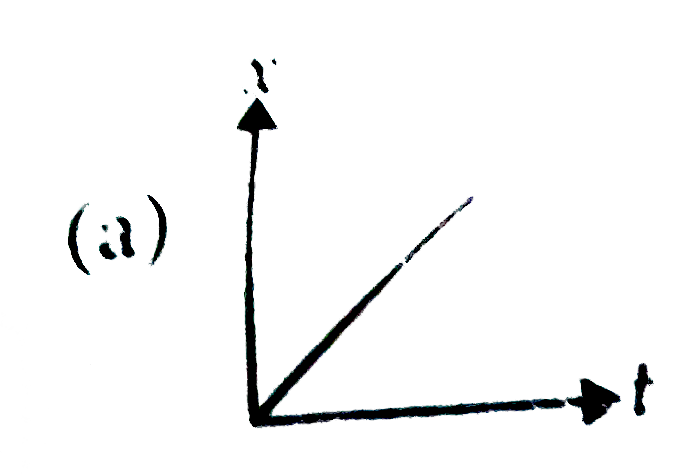 B
B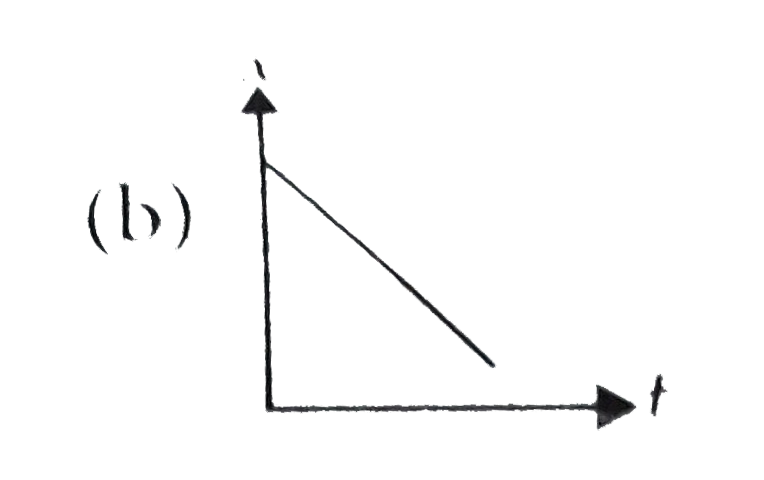 C
C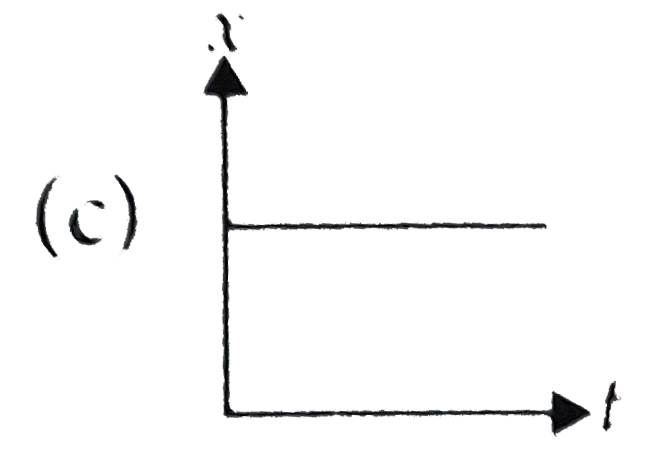 D
D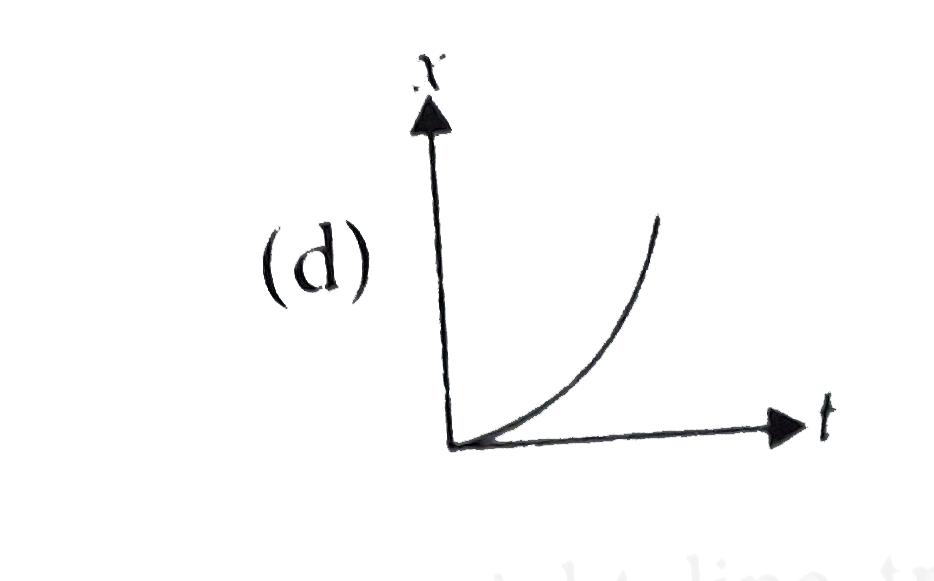
- Question 2 - Select One
Which of the following cannot be speed (v) - time (t) graph?
A B
B C
C D
D
- Question 3 - Select One or More
Which of the following graphs cannot represent one dimensional motion of a particle?
A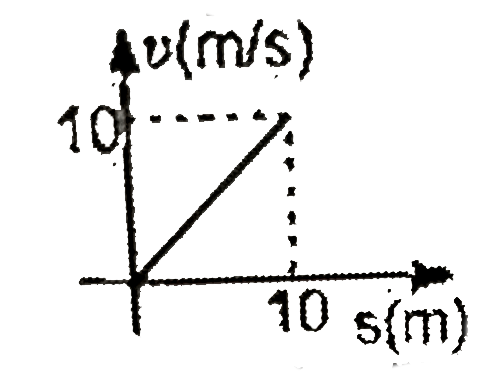 B
B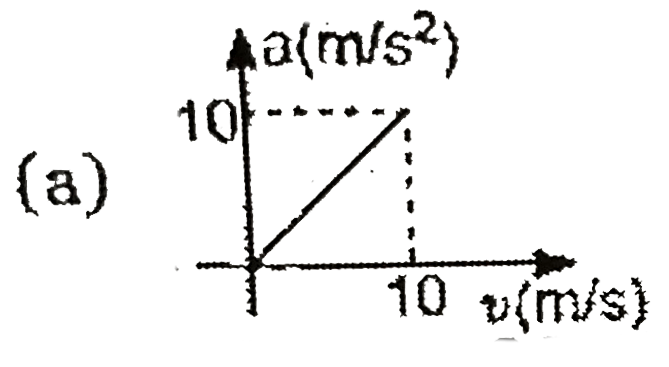 C
C D
D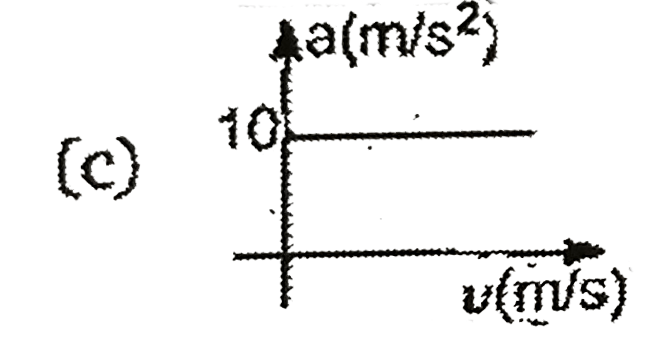
Which of the following graphs are graphs of a function?
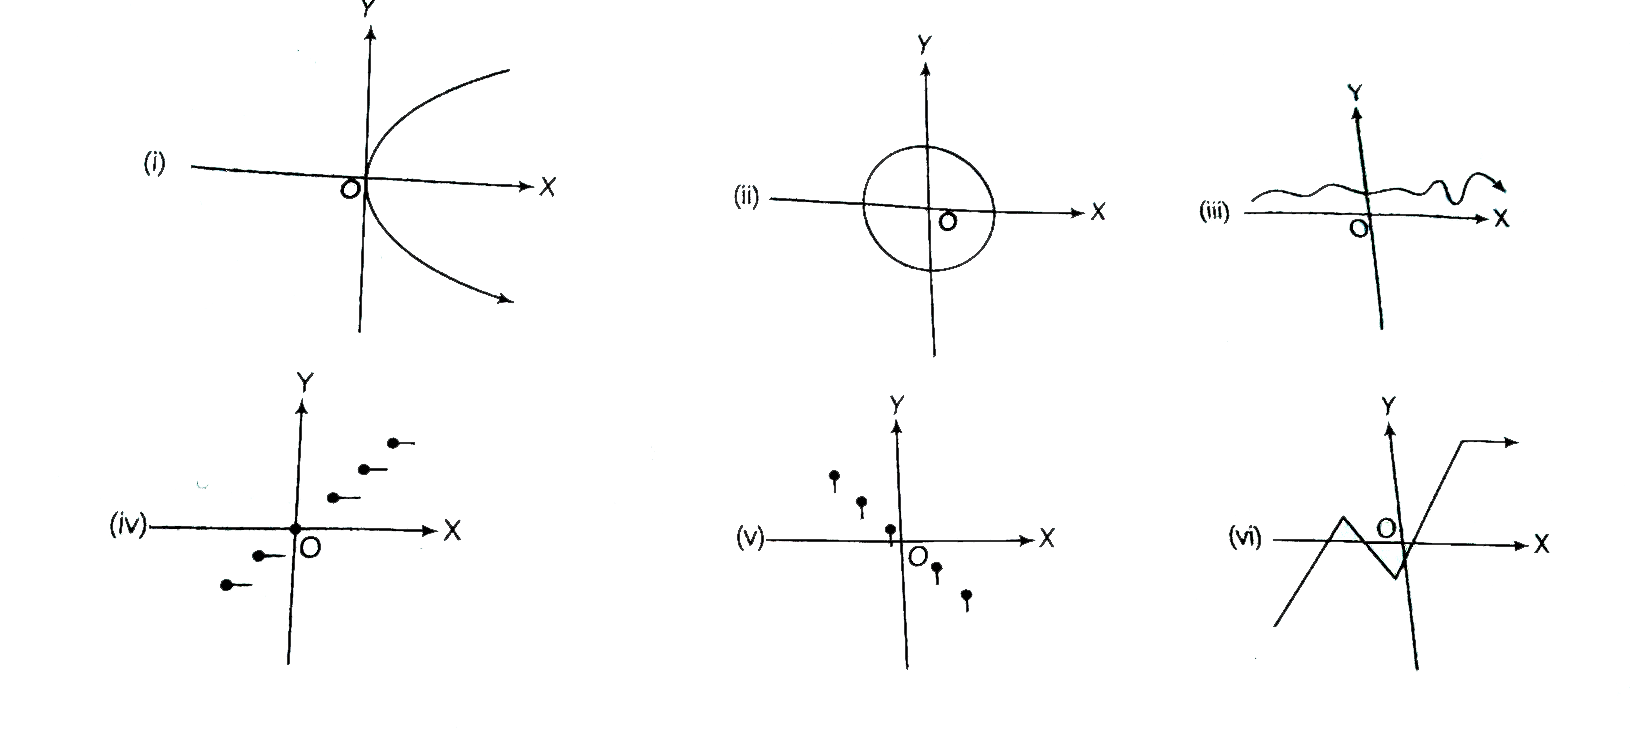
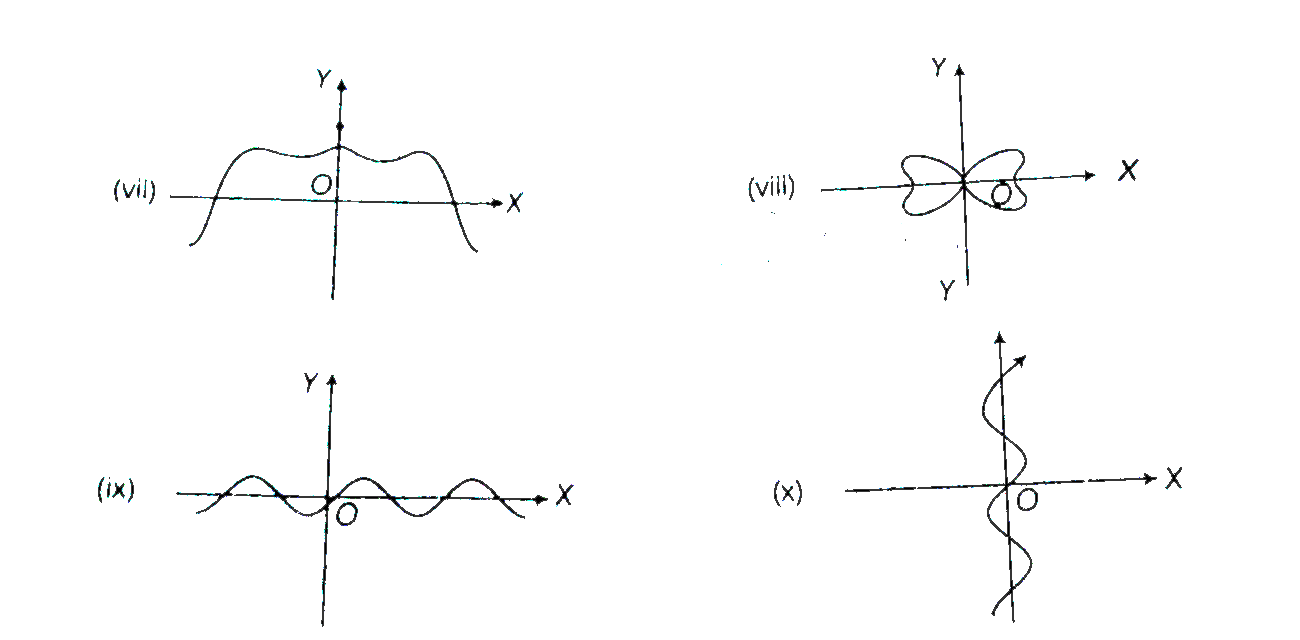 View Solution
The displacement-time graph of a particle executing simple harmonic motion is shown in the figure
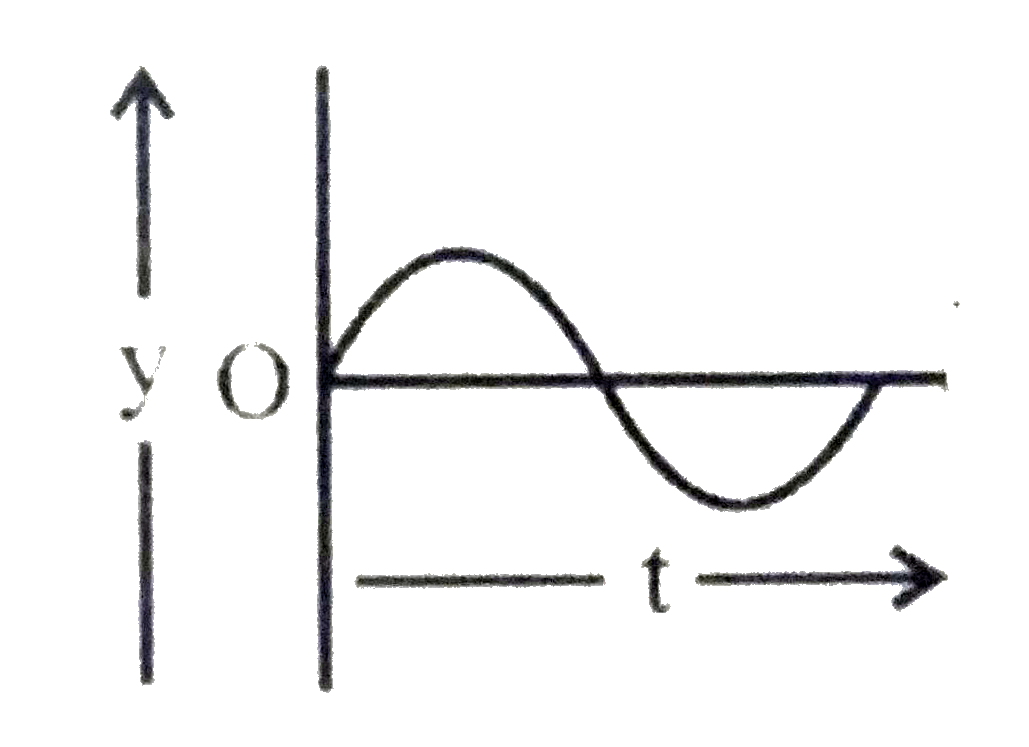
Which one of the following graphs is the correct forcetime graph for the motion of the particle ?View SolutionWhich of the following graphs cannot possibly represent one dimensional motion of a particle?
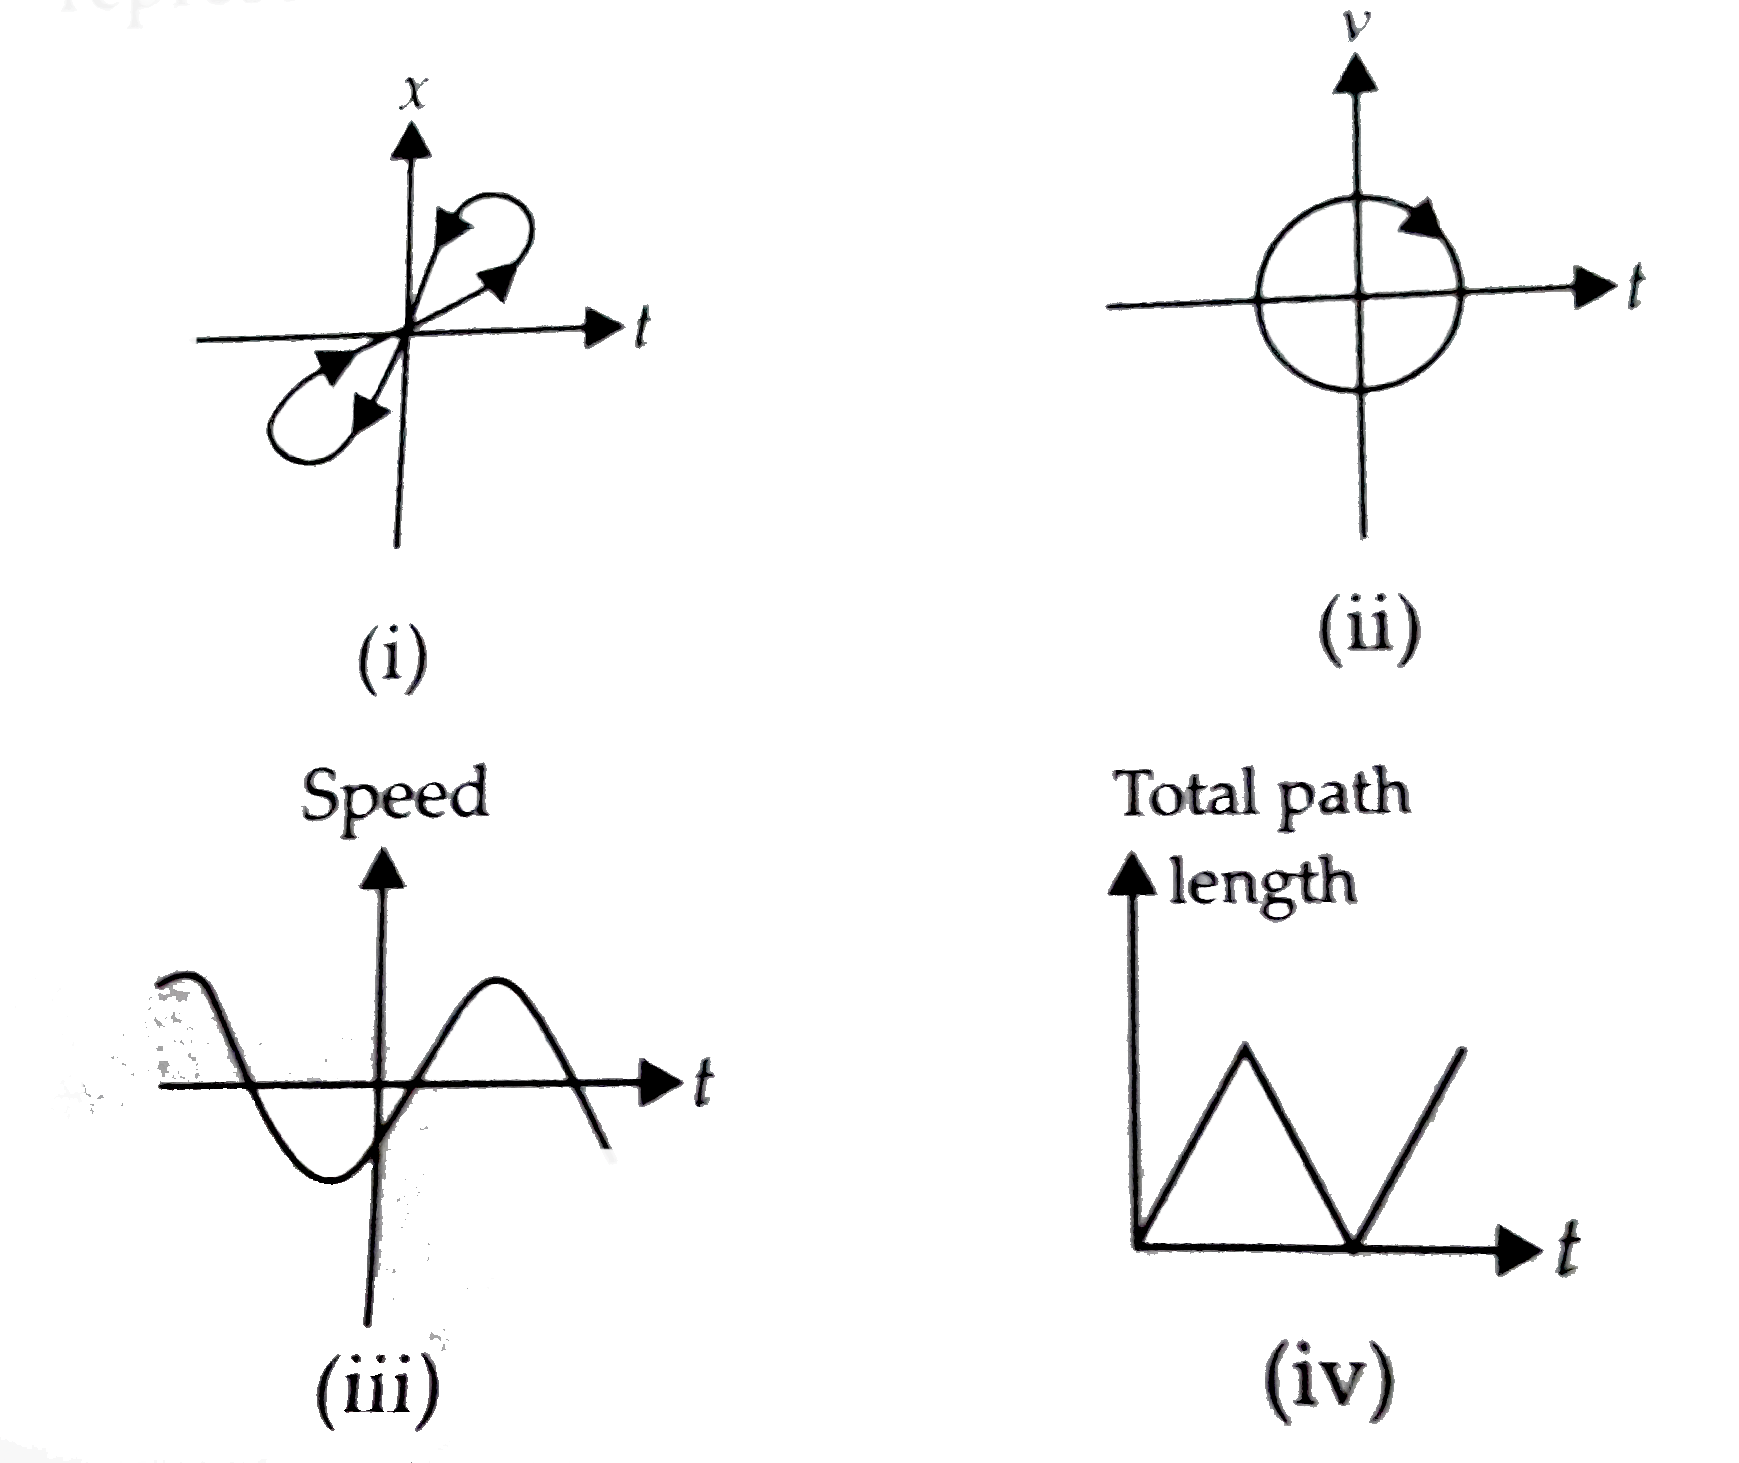 View Solution
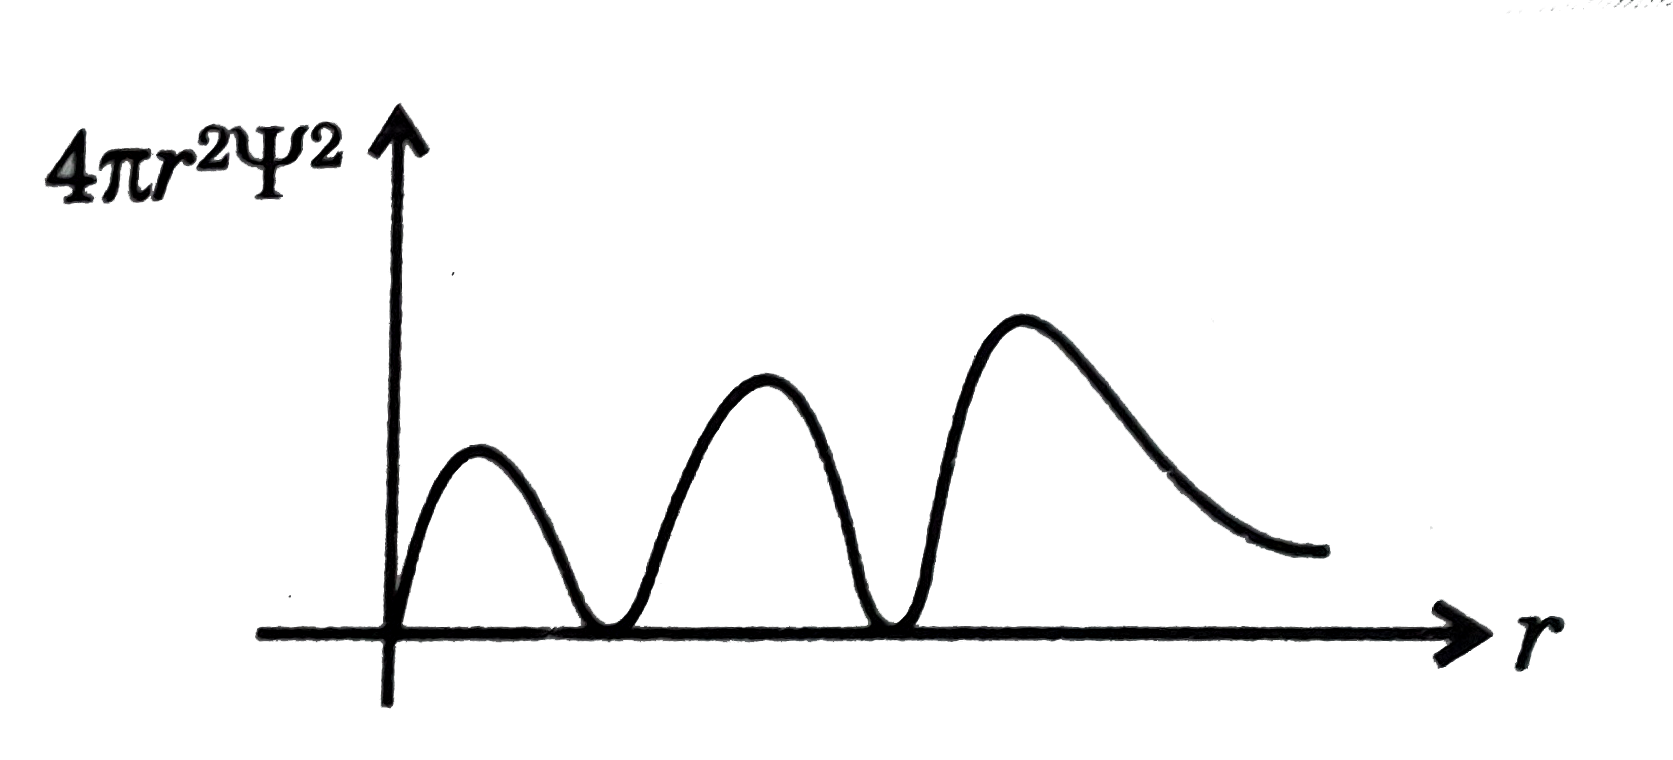
The above graph cannot be of:View SolutionA ball is thrown vertically upwards. Which of the following graph/graphs represent velocity time graph of the ball during its flight ( air resistance is neglected).
View Solution


 .
.