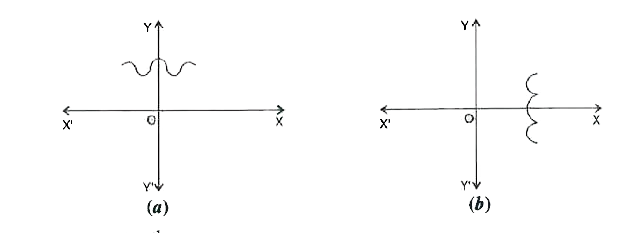
Which one of the following graphs represents the function of x? why?
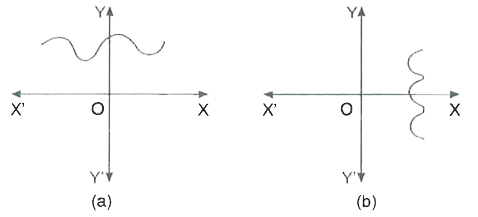
The correct Answer is:(a) Because in (b) at some x, there are many values of y
Step by step video, text & image solution for Which one of the following graphs represents the function of x? why? by Maths experts to help you in doubts & scoring excellent marks in Class 12 exams.
Updated on:21/07/2023Topper's Solved these Questions
- RELATIONS AND FUNCTIONSBOOK - MODERN PUBLICATIONCHAPTER - RELATIONS AND FUNCTIONSEXERCISE - NCERT - FILE (Question from NCERT Book) (Exercise 1.1)
16 Videos
- RELATIONS AND FUNCTIONSBOOK - MODERN PUBLICATIONCHAPTER - RELATIONS AND FUNCTIONSEXERCISE - NCERT - FILE (Question from NCERT Book) (Exercise 1.2)
12 Videos
- RELATIONS AND FUNCTIONSBOOK - MODERN PUBLICATIONCHAPTER - RELATIONS AND FUNCTIONSEXERCISE - Objective Type Questions (C. True/False Questions)
5 Videos
- PROBABILITYBOOK - MODERN PUBLICATIONCHAPTER - PROBABILITYEXERCISE - MOCK TEST SECTION D
6 Videos
- THREE DIMENSIONAL GEOMETRY BOOK - MODERN PUBLICATIONCHAPTER - THREE DIMENSIONAL GEOMETRY EXERCISE - CHAPTER TEST 11
11 Videos
Similar Questions
Knowledge Check
Which one of the following graphs represents motion?
A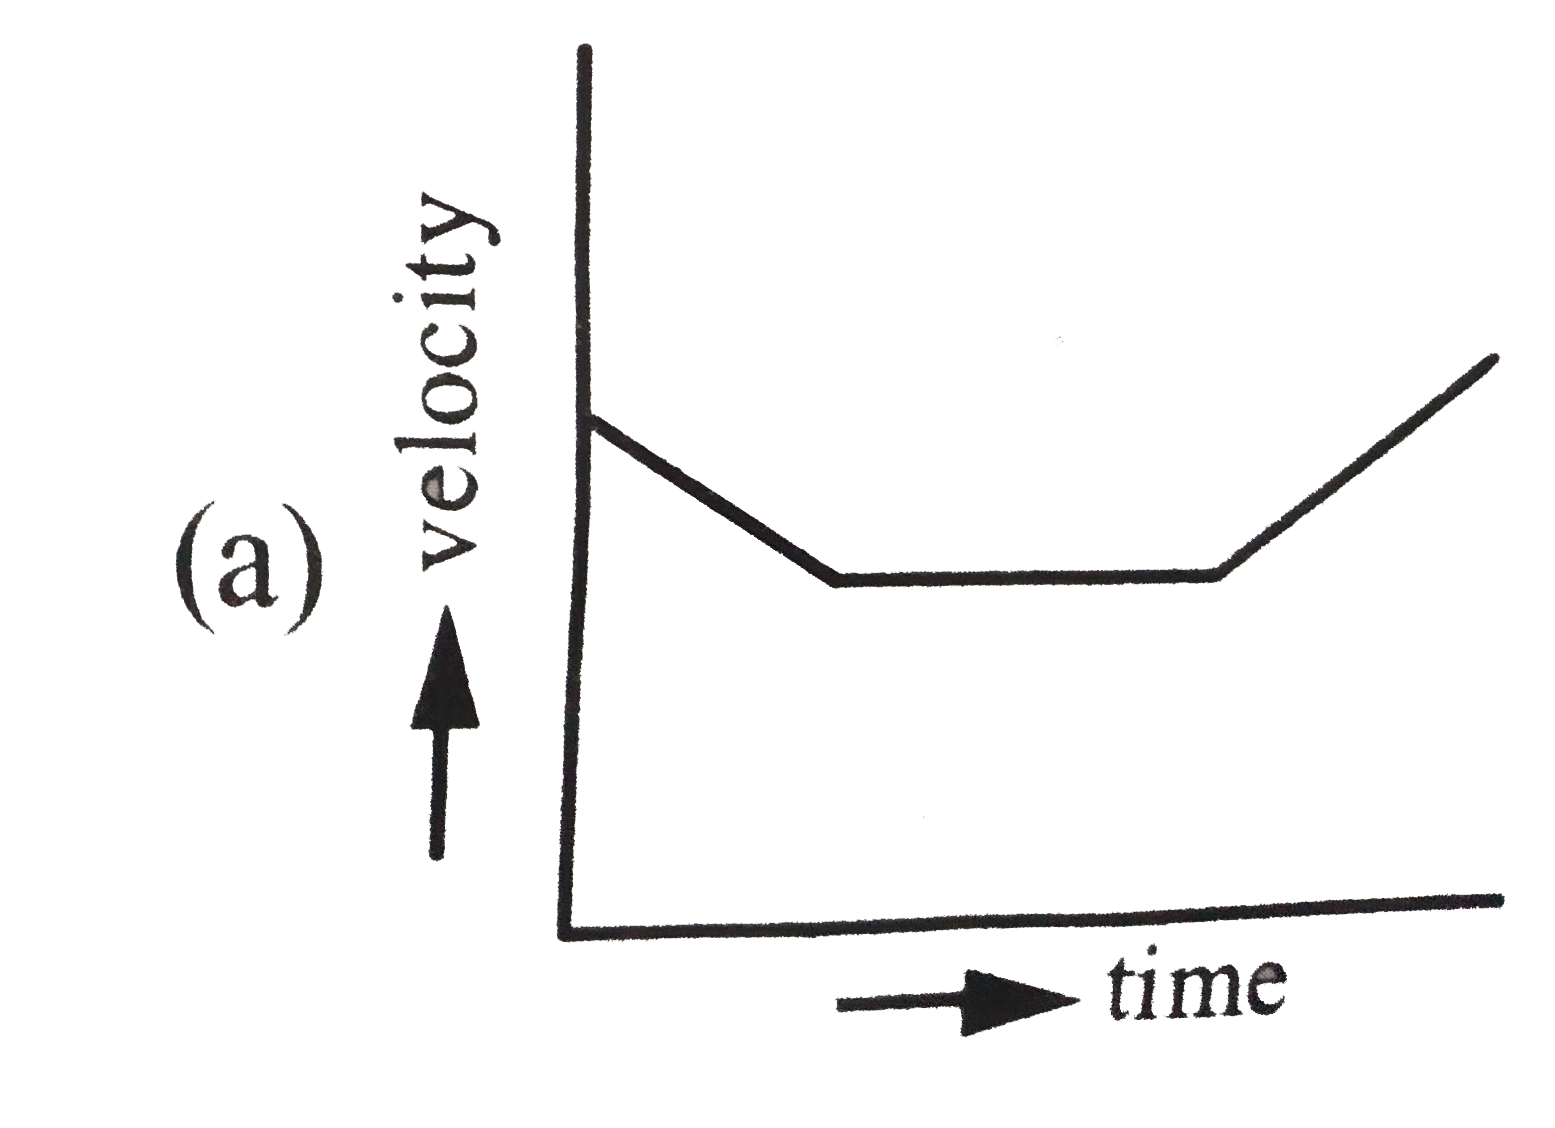 B
B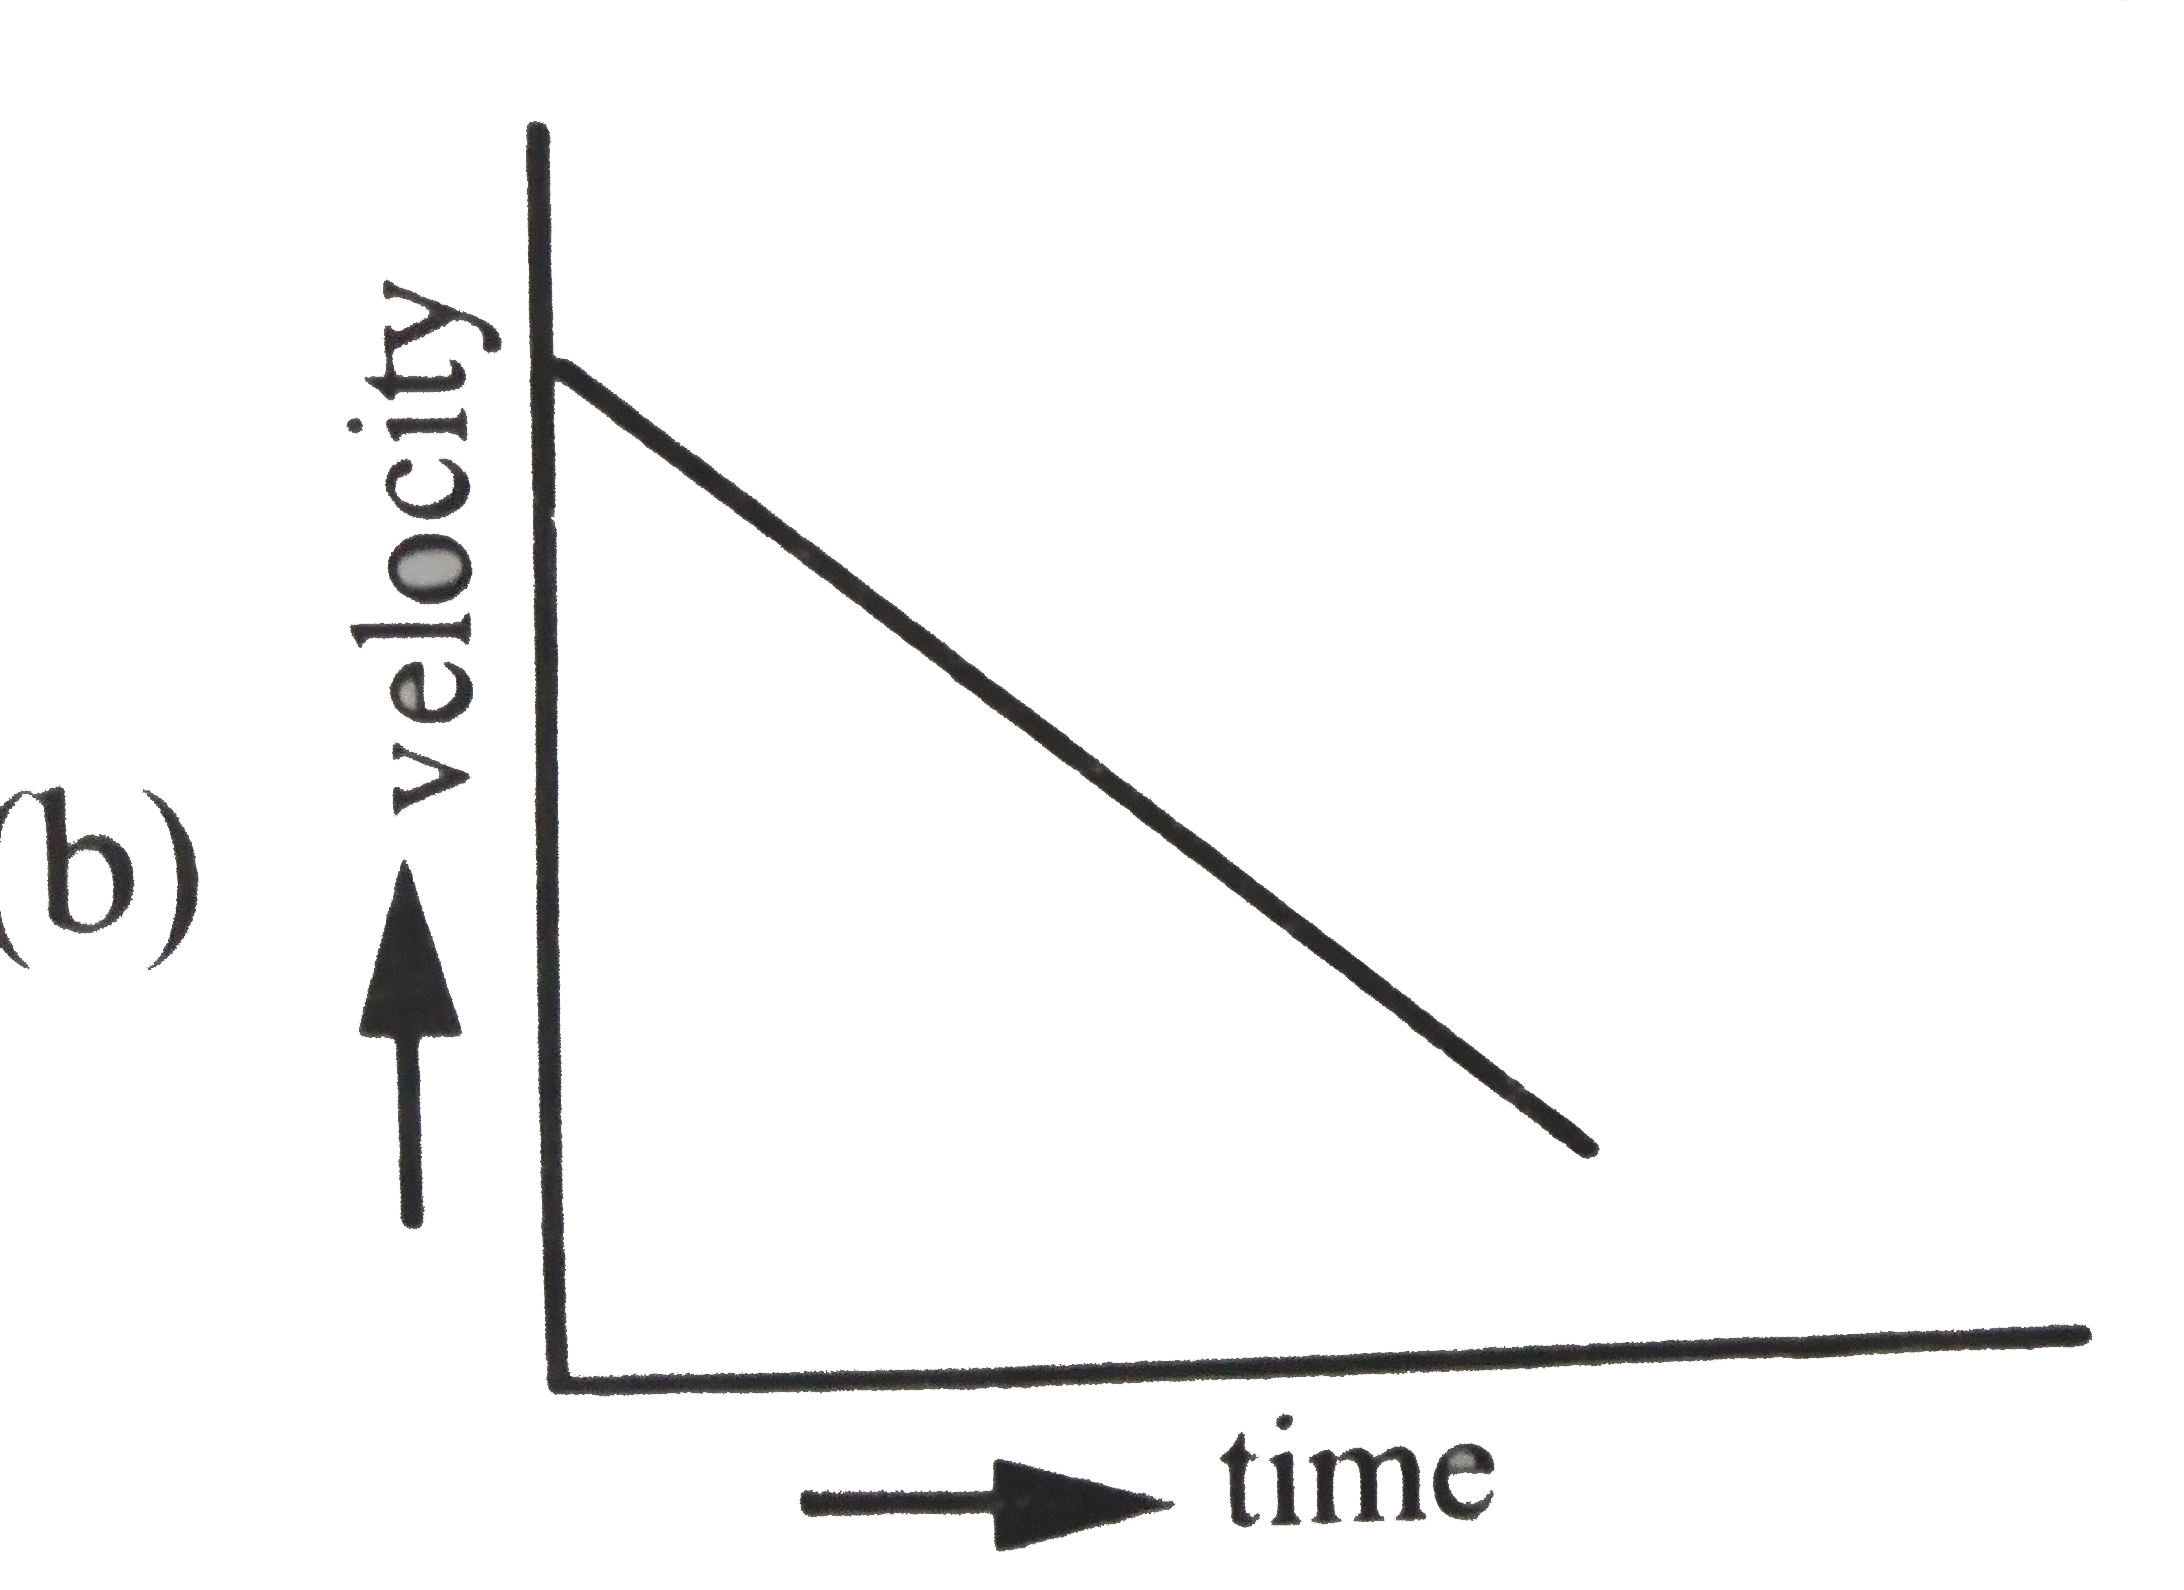 C
C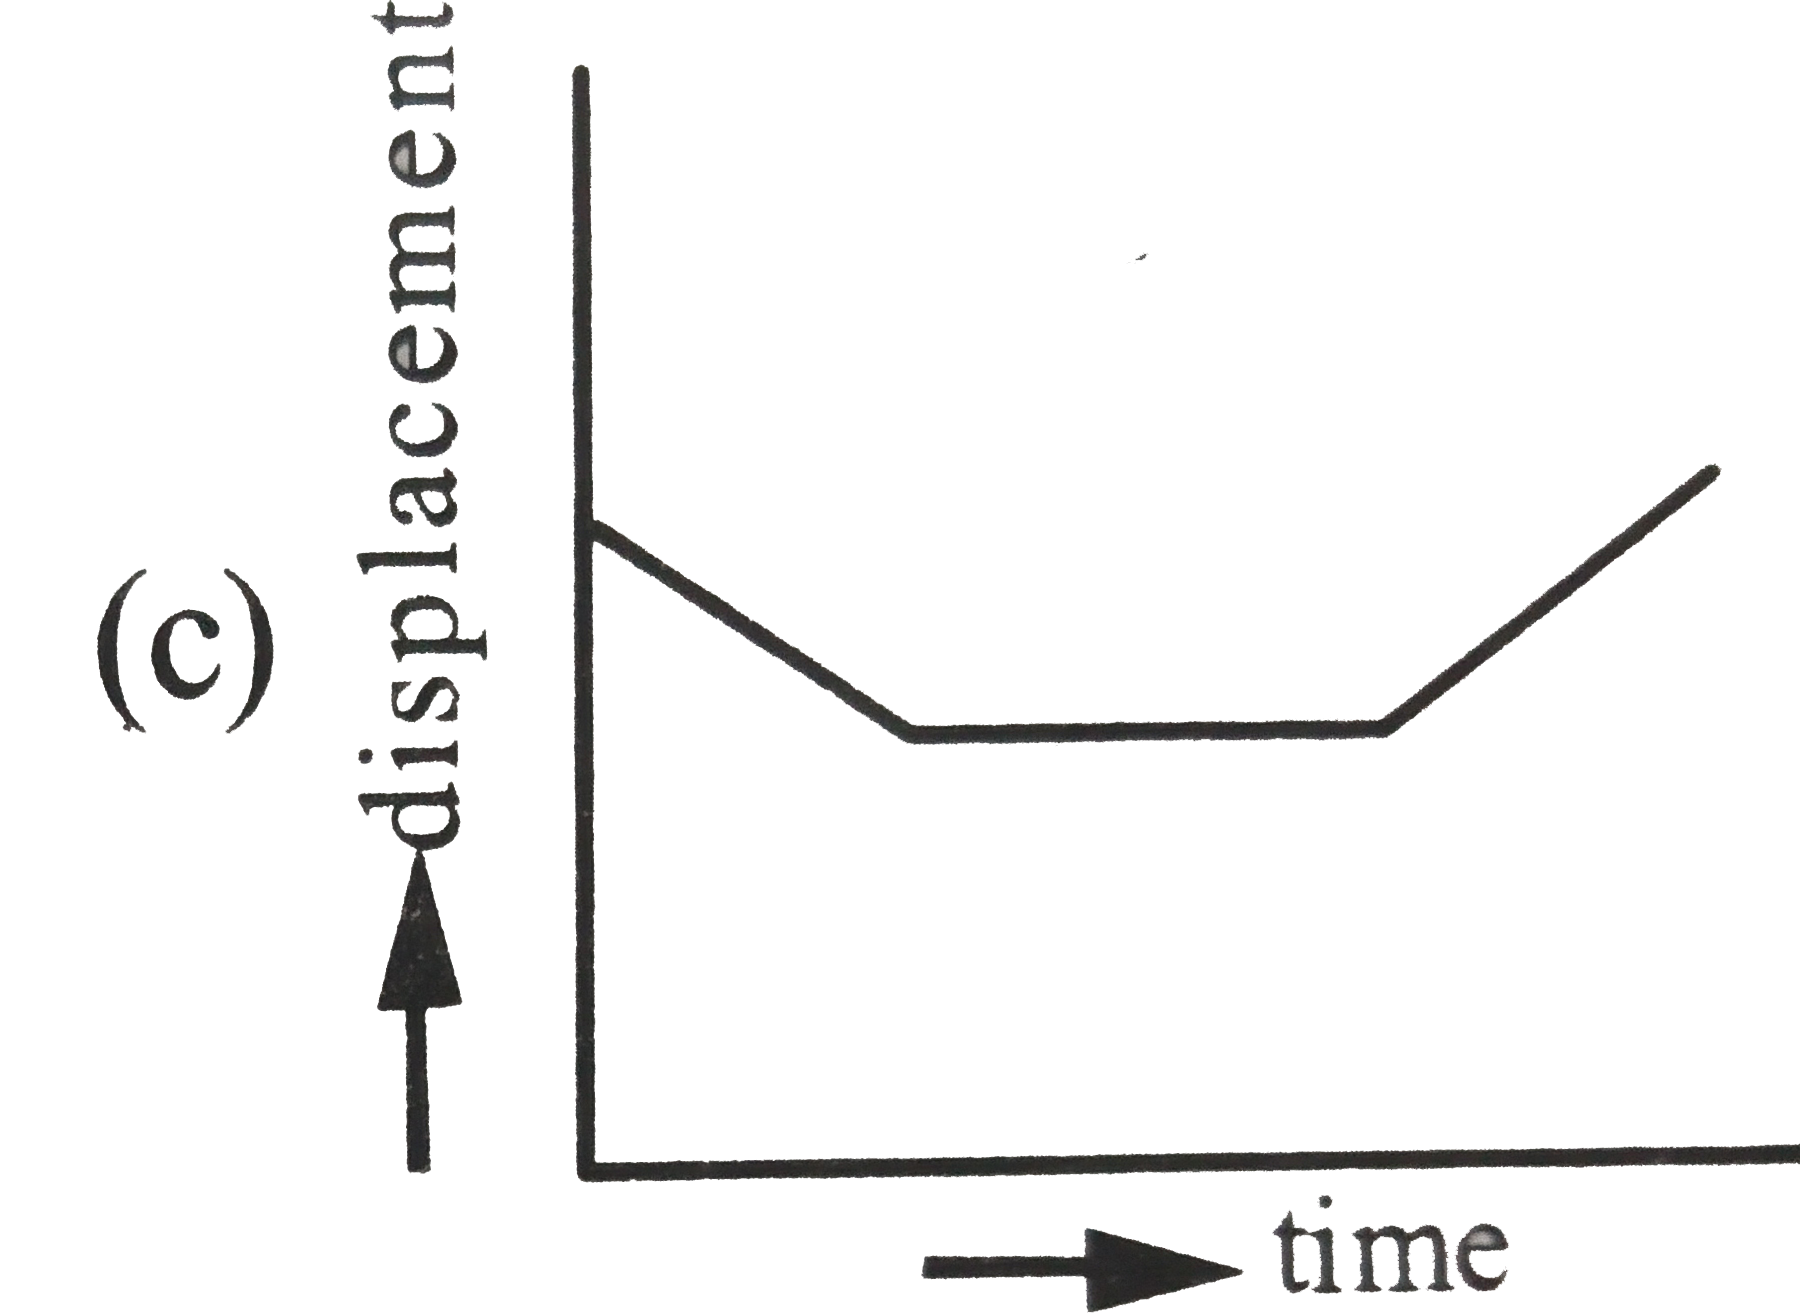 D
D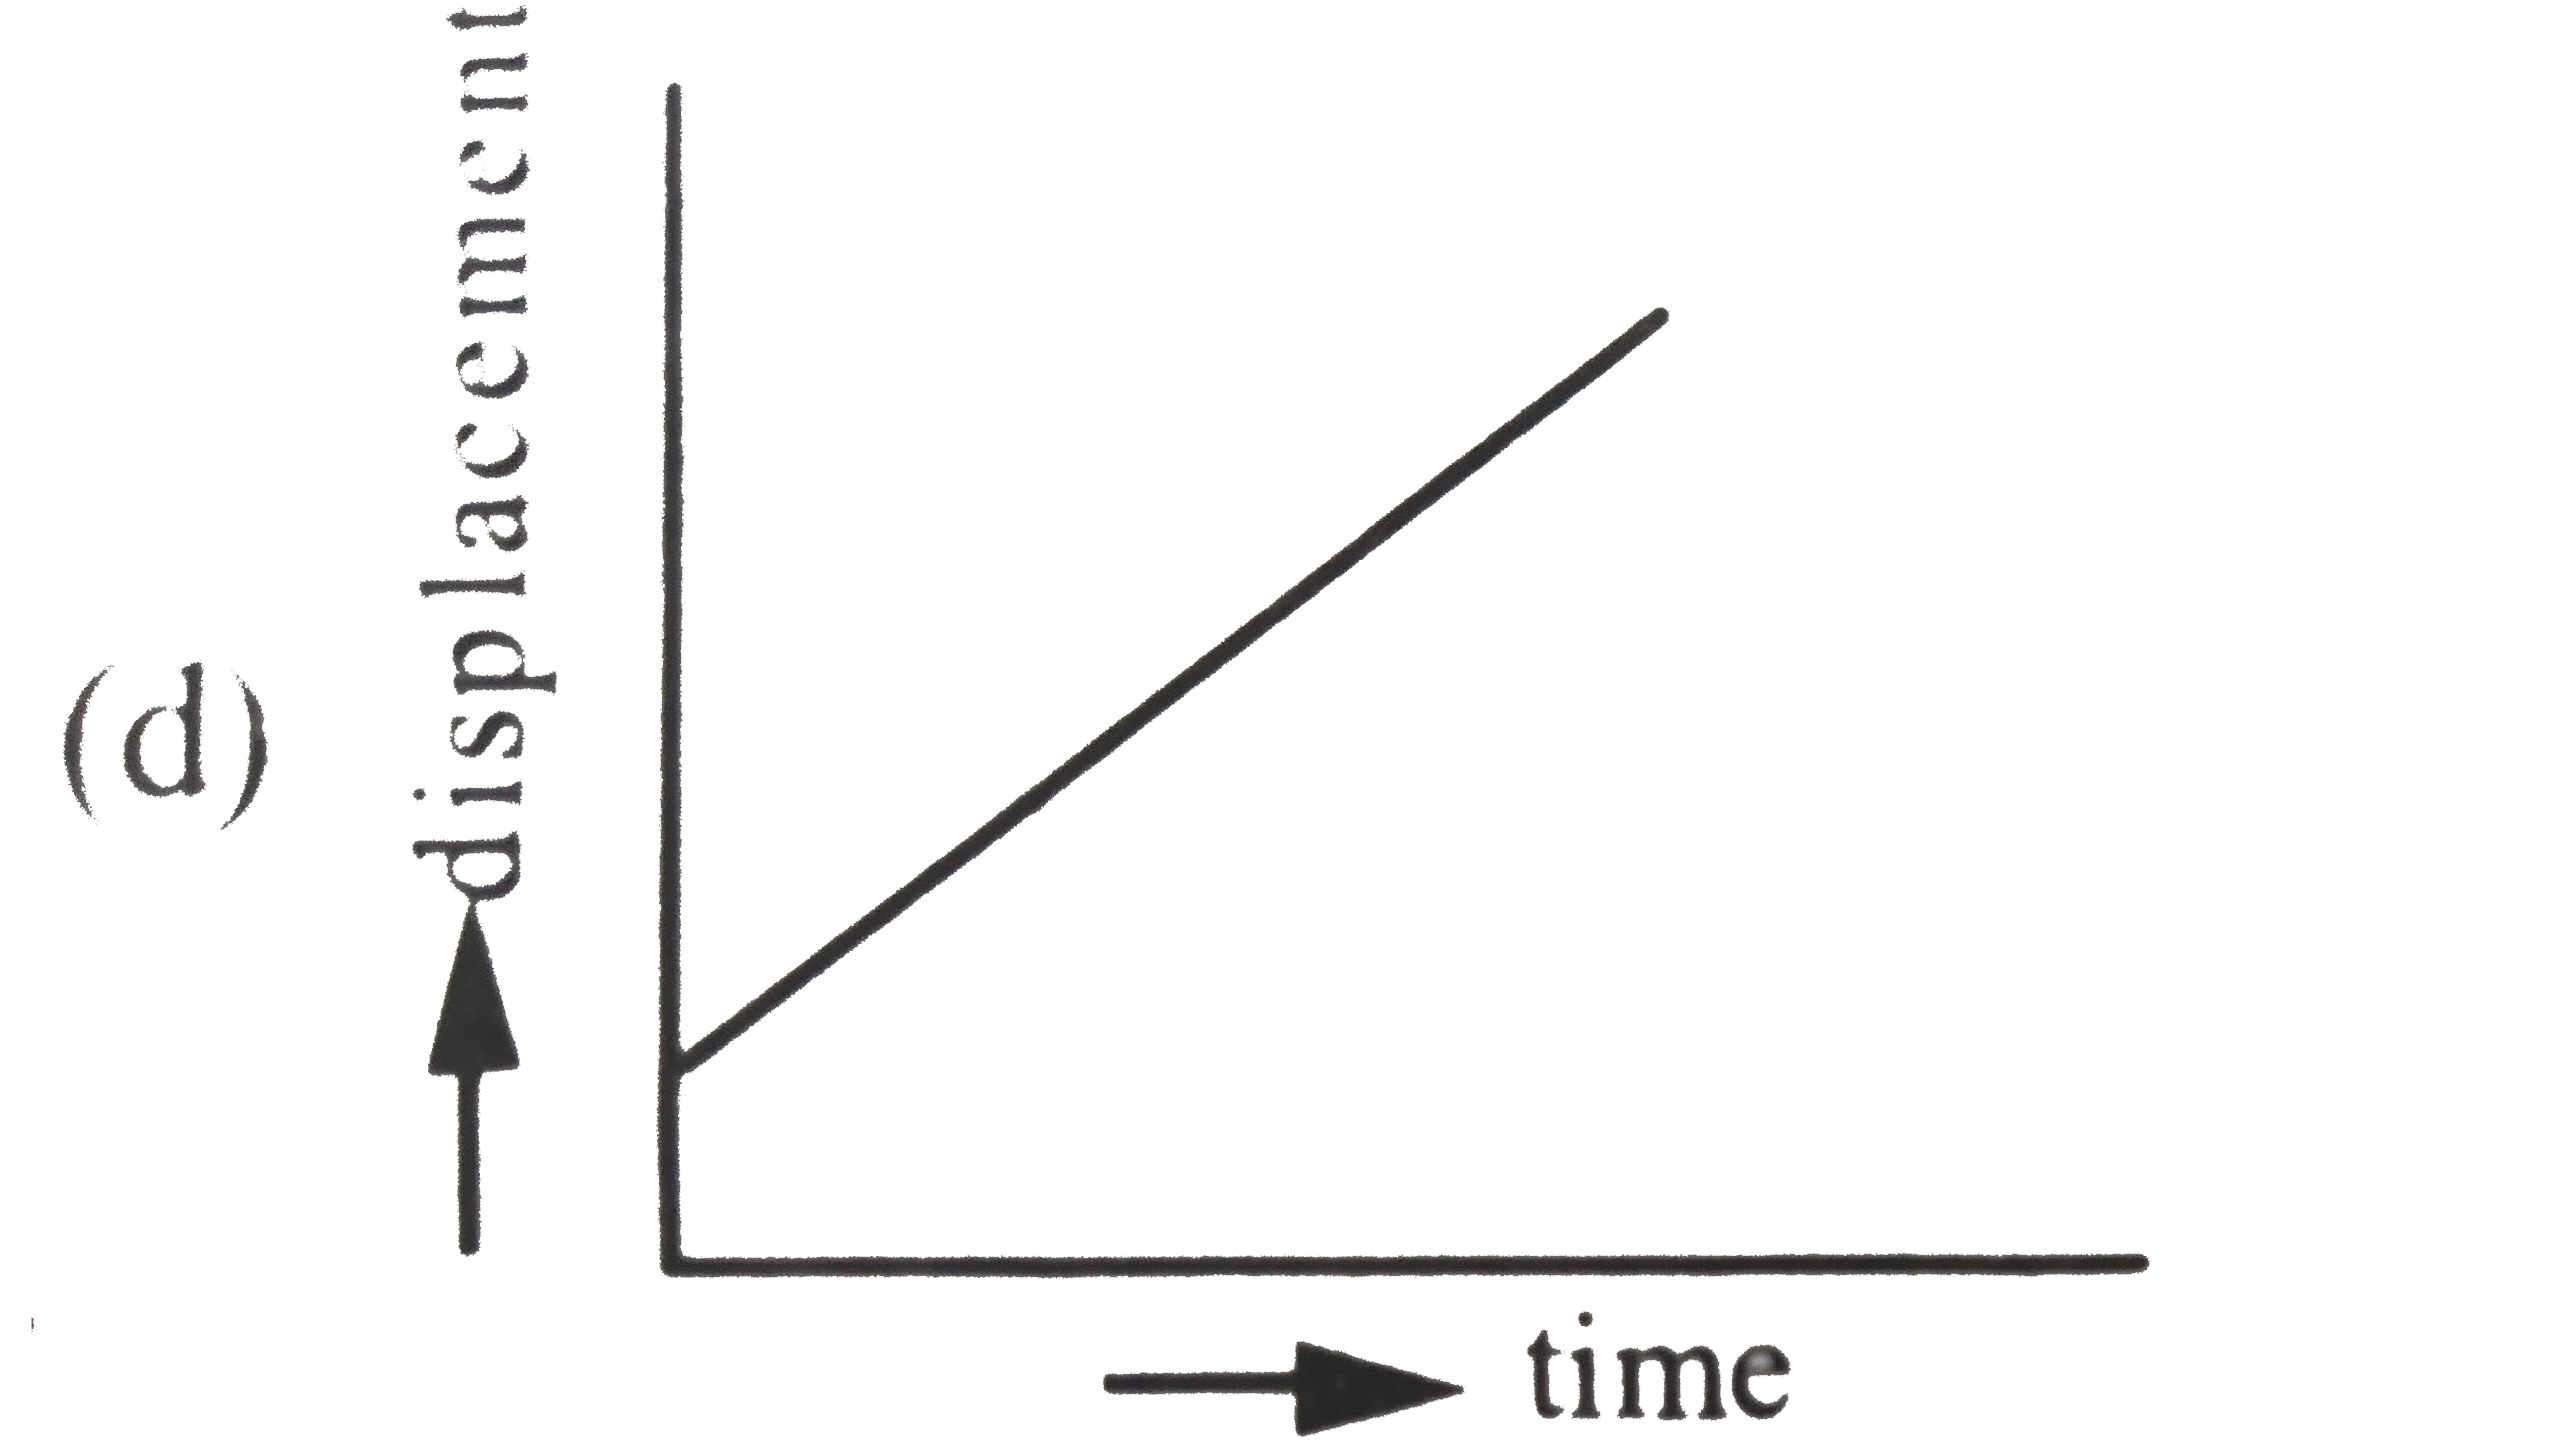
Which of the following graph represents e−x?
A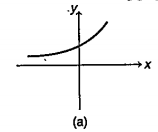 B
B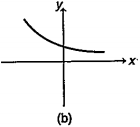 C
C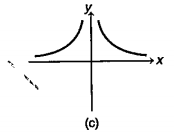 D
D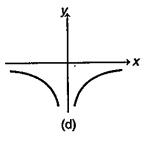
Which of the following graph represents e−x?
A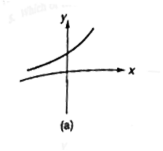 B
B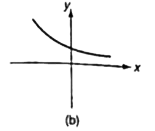 C
C D
D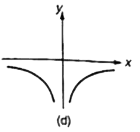
Which of the following graph represents exothermic reaction ?
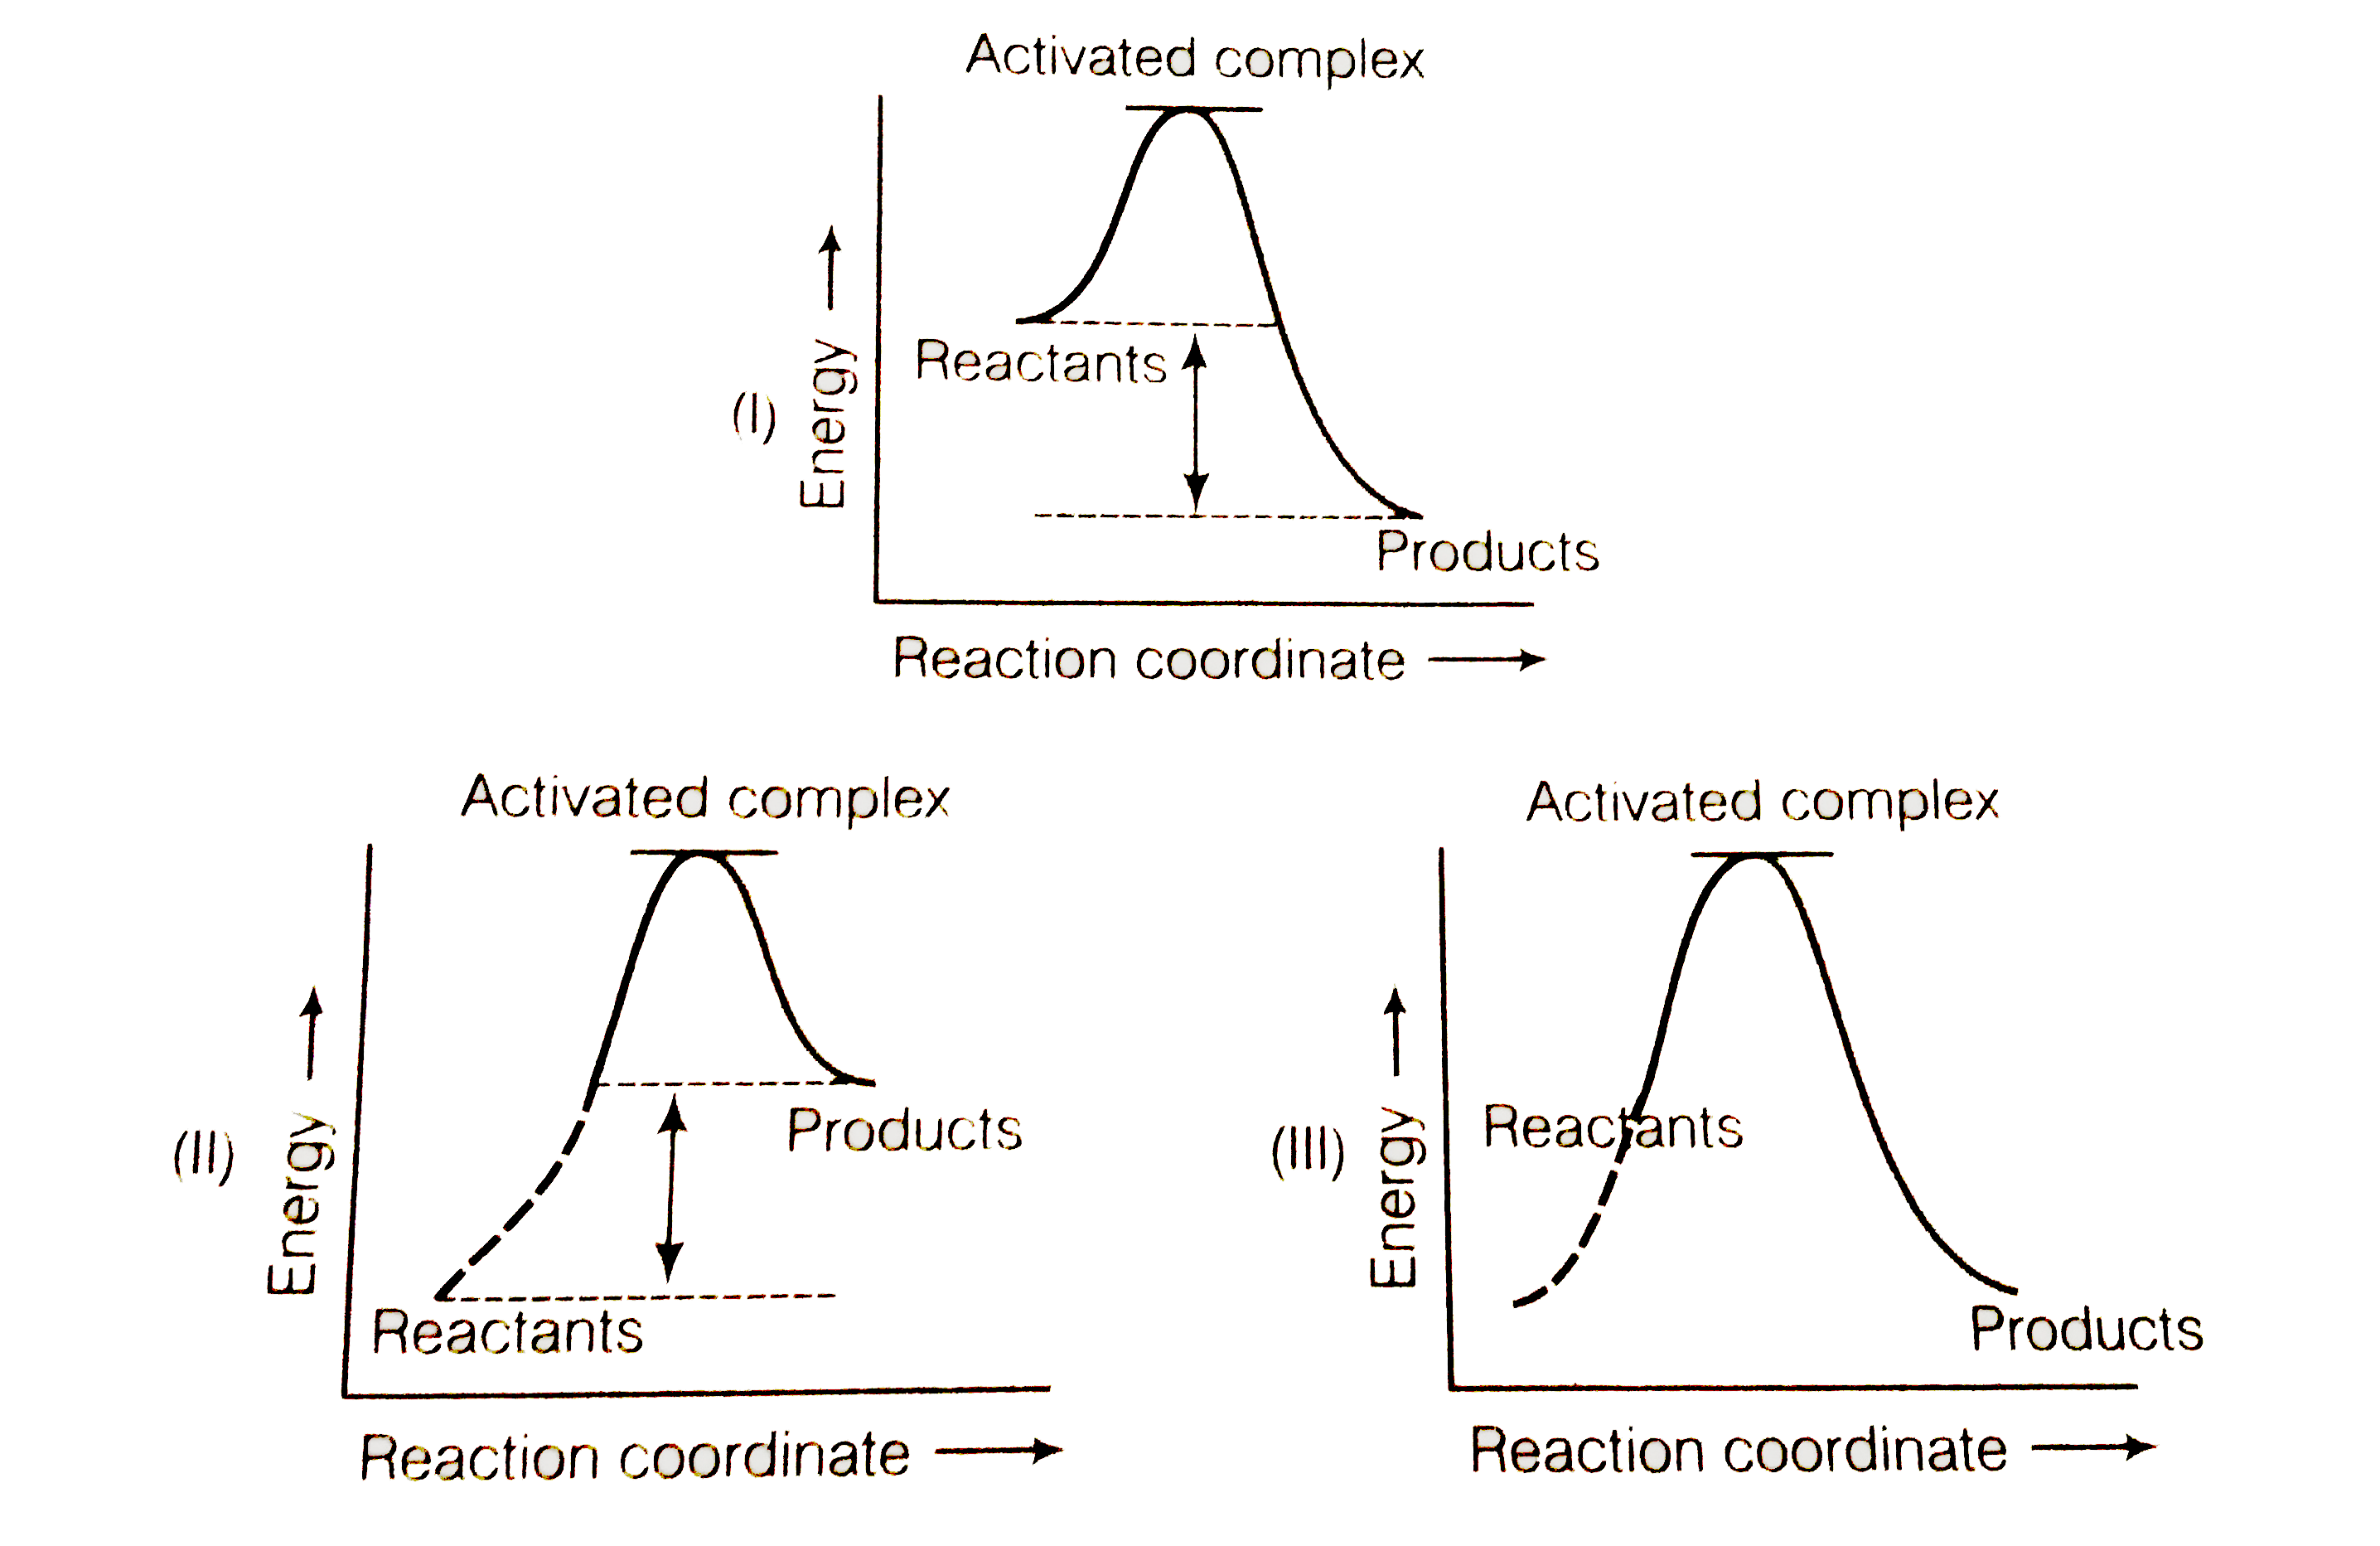
View SolutionWhich of the following graphs represents exothermic reaction?

View SolutionWhich of the following graph represents 3s orbital
View SolutionA body moves from rest with a constant acceleration. Which one of the following graphs represents the variation of its kinetic energy K with the distance travelled x?
View SolutionA body moves from rest with a constant acceleration. Which one of the following graphs represents the variation of its kinetic energy K with the distance travelled x?
View Solution

