Which one of the following is not the graphical representation of statistical data: bar graph (b) Histogram Frequency polygon (d) Comulative frequency distribution
To determine which option is not a graphical representation of statistical data, we can analyze each option provided:
1. Bar Graph:
- A bar graph is a graphical representation that uses bars to show the frequency of different categories. It is commonly used to compare different groups or categories visually.
- Conclusion: This is a graphical representation.
2. Histogram:
- A histogram is similar to a bar graph but is used for continuous data. It represents the frequency distribution of numerical data by using adjacent bars.
- Conclusion: This is also a graphical representation.
3. Frequency Polygon:
- A frequency polygon is a graphical representation that uses line segments to connect points representing the frequencies of different intervals. It is often used to show the shape of the distribution of a dataset.
- Conclusion: This is a graphical representation.
4. Cumulative Frequency Distribution:
- A cumulative frequency distribution is a table that shows the cumulative totals of frequencies for different intervals. While it provides a way to understand the accumulation of frequencies, it is not a graphical representation by itself.
- Conclusion: This is not a graphical representation.
Based on the analysis above, the answer to the question is:
Answer: (d) Cumulative Frequency Distribution
- A bar graph is a graphical representation that uses bars to show the frequency of different categories. It is commonly used to compare different groups or categories visually.
- Conclusion: This is a graphical representation.
- A histogram is similar to a bar graph but is used for continuous data. It represents the frequency distribution of numerical data by using adjacent bars.
- Conclusion: This is also a graphical representation.
- A frequency polygon is a graphical representation that uses line segments to connect points representing the frequencies of different intervals. It is often used to show the shape of the distribution of a dataset.
- Conclusion: This is a graphical representation.
- A cumulative frequency distribution is a table that shows the cumulative totals of frequencies for different intervals. While it provides a way to understand the accumulation of frequencies, it is not a graphical representation by itself.
- Conclusion: This is not a graphical representation.
Topper's Solved these Questions
Similar Questions
Knowledge Check
- Question 1 - Select One
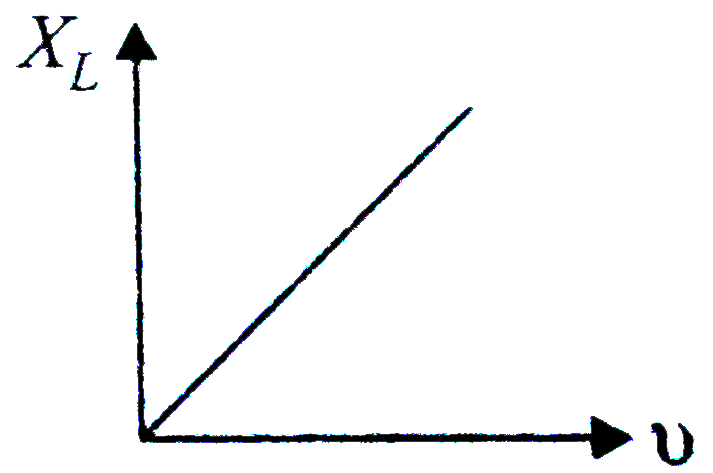
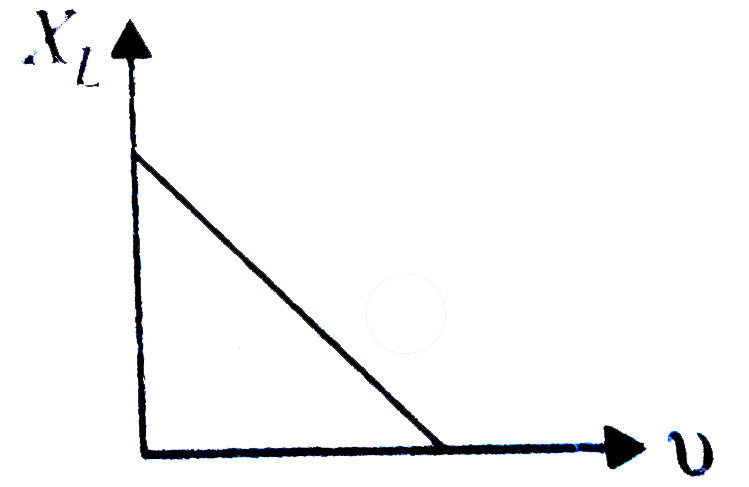
Which of the following graphs represent the correct variation of inductive reactance XL with frequency υ?
A B
B C
C D
D
Construct a frequency polygon for the following distribution :
 View Solution
Draw a histogram and frequency polygon from the following data:
 View Solution
Find the M.D. from median of the following frequency distribution
 View Solution
The mode of a frequency distribution can be determined graphically from (a) Histogram (b) Frequency polygon (c) Ogive (d) Frequency curve
View SolutionDraw frequency polygons for each of the following frequency distributions :
using histogram
 View Solution
Draw a frequency polygon from the following data:
 View Solution
Construct a frequency polygon for the following data :
 View Solution


