Complete Solutions to Exercise of chapter STATISTICS of Class 10 book with complete answers and questions
| Class 10 | MATHS |
| Chapter | STATISTICS |
| MBD | Exercise |
| Number Of Questions | 54 |
| Academic Year | 2023-24 |
In a city, the following weekly observations were made in a study of cost of living index for the year 1980-81.
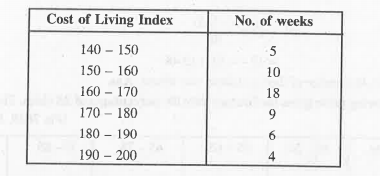 Calculate the mean weekly cost of living index by a suitable method.
View SolutionThe following table gives the distribution of total household expenditure (in Rs) of mannual workers in a city. Find the mean expenditure (in Rs) per household by using on approximate method.
 What does mean signify?
View SolutionA frequency distribution of the life times of 400 T.V. Picture tubes tested in tube company is given below. Find the average life of tube ?

View SolutionCompute the missing frequencies `f_1` and `f_2` in the following data if the mean is `166frac(9)(26)` sum of observations is 52.

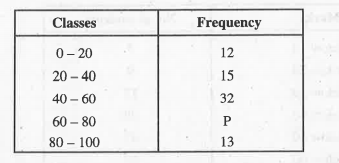
View SolutionThe arithmatic mean of the following data is 14, find the value of P.

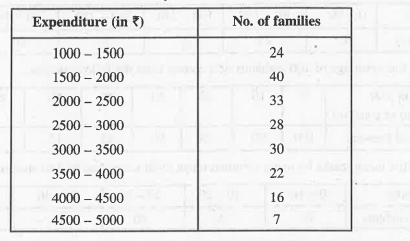
View SolutionThe following table gives the distribution of different families on education. Find mean expenditure on education of a family.
View SolutionFind the value of P, if the arithmatic mean of the following distribution is 53.
View SolutionA candidate obtains the following percentage of marks in an examination :
 Find the weighted mean if weights 2, 1,5,5,3, are alloted to Eglish, Hidi Mathematics, Physics, Chemistry.
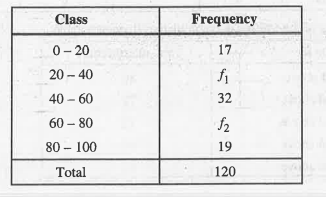
View SolutionThe mean of the following frequency table is 50, but the frequency `f_1`and `f_2` in classes 20 - 40 and 60 -80 respectively are not known. Find these frequencies.
View SolutionIf the mean of the following frequency distribution is 188. Find the missing frequencies `f_1` x and `f_2`

View SolutionFind the mean age of 100 residents of a colony from the following data :

View SolutionFind the mean marks by using assumed mean method secured by 140 students in statistics.

View SolutionFind the mean marks of the following data :
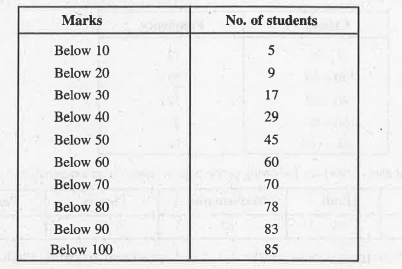
View SolutionUsing step deviation method, calculate the mean of the following data :

View SolutionFind the mean marks of the following cummulative frequency table :
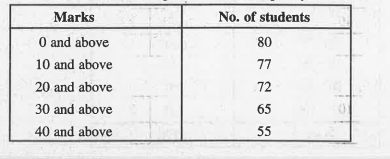
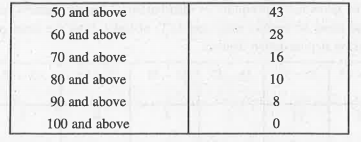
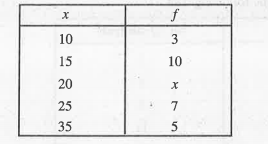
View SolutionIf the mean of the following data is 20.6. Find the missing frequency (x).
View SolutionThe following table gives the enrollment in higher secondary school in 1978. Find the mean enrolment per H.S. School.
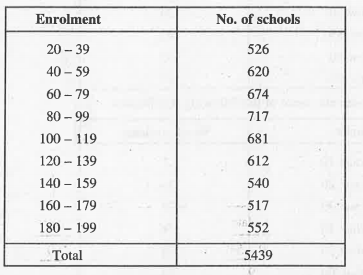
View SolutionFind the mean of the following data using deviation method :

View SolutionFind the mean of the following data using deviation method :

View SolutionThe table below gives the expenditure of distribution of female teachers in the primary schools of rural areas of various states and U.T. of India. Find the mean percentage of female teachers by step deviation method.

View SolutionFind the mean marks from the following data :
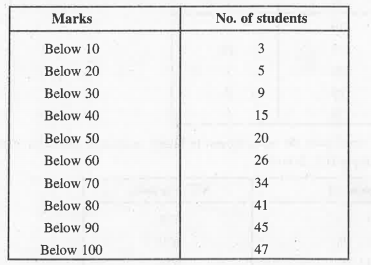
View SolutionCalculate the arithmetic mean of the following distribution.
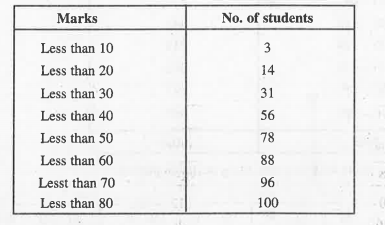
View SolutionCalculate the mean of the following :

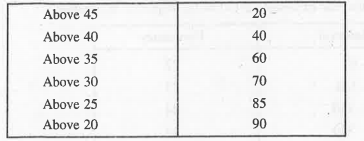
View SolutionFind the mean of the following distribution :
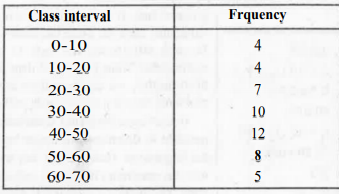
View SolutionFind the mean of the following data :
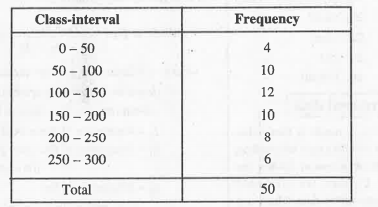
View SolutionCalculate the arithmetic mean of the following distribution
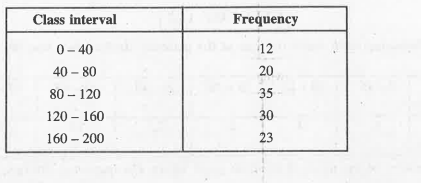
View SolutionCalculate the arithmetic mean for the following frequency distribution :
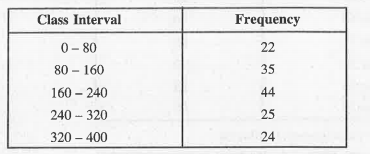
View SolutionA survey conducted on 20 households in a locality by a group of students resulted in the following frequency table for the number of family members in a household :

Find the mode of this data.
View SolutionThe following table shows the ages of the students during a year are :

Find the mode.
View SolutionThe following table givesthe information on the observed lifetimes(in hours) of 215 electrical components.

Determine the modal lifelines of the components.
View SolutionFind the mode of the following distribution :

View SolutionFind the mode of the following distribution.

View SolutionFind the mode of the following distribution :

View SolutionFind the mode of the following distribution :

View SolutionFind the mode of the following data:

View SolutionFind the mode of the following frquency distribution :

View SolutionFind the mode of the following distribution :

View SolutionFind the mode of the following distribution :

View SolutionA survey regarding the heigths (in cm) of 51 girls of Class X of a school was conducted and the following data was obtained :
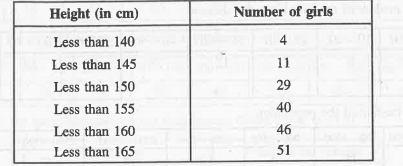
Find the median height.
View SolutionThe median of the following data is 525. Find the values of x and y, if the total frequency is 100.
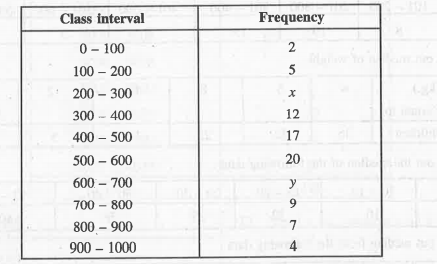
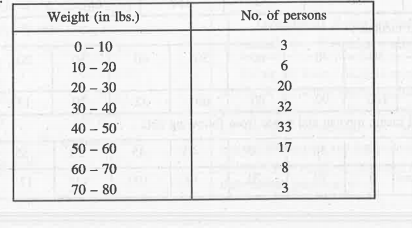
View SolutionFrom the data of weight of 122 persons determine median .
View SolutionThe annual profits earned by 30 shops of a shopping complex in a locality gives rise to following distribution.
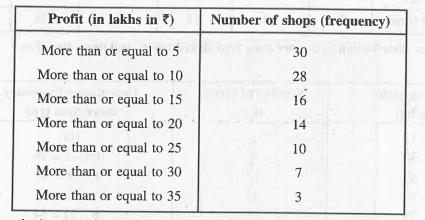
Draw both ogves for the data above. Hence obtain the median profit.
View SolutionOn the basis of the following frequency distribution draw less than cumulative frequency curve.

View SolutionHeight of 50 plants in a garden were recorded and data is presented as below:

Draw ‘less than’ ogive and ‘more than’ ogive simultaneously on the same graph and find the median of the data from graph. Also verify your result by using formula.
View SolutionThe following table shows the distribution of salaries of a group of workers :

Determine cumulative frequencies
Draw the cumulative frequency curve i.e. less than ogive on a graph paper.
From graphs, write down the median salary (in Rs)?
View SolutionDetermine median-value of the following series using graphic method : (i.e., By less than ogive, By more than ogive approach)

View SolutionDraw ‘less than ogive’ for the following data and determine median :

View SolutionMake a ‘more than’ cumulative frequency on the bases of no. of workers working in factories :

View SolutionDraw less than ogive curve.

View SolutionDraw an ogive curve from the following data and find out : Median wage

View SolutionDraw ‘less than’ cumulative frequency curve on the basis of following distribution :

View SolutionDraw the cumulative frequency curve for the following given data :

View SolutionDraw the less than cumulative frequency graph for he following data :

View SolutionDraw the less than cummulative frequency graph for the following distribution giving 300 telephone calls according to the duration in seconds.

View Solution
Exercise questions and complete solutions for chapter STATISTICS of MBD of Class 10