Draw the less than cummulative frequency graph for the following distribution giving 300 telephone calls according to the duration in seconds.
 Solution in Punjabi
Step by step video & image solution for Draw the less than cummulative frequency graph for the following distribution giving 300 telephone calls according to the duration in seconds. by Maths experts to help you in doubts & scoring excellent marks in Class 10 exams.
Updated on:21/07/2023Topper's Solved these Questions
Similar Questions
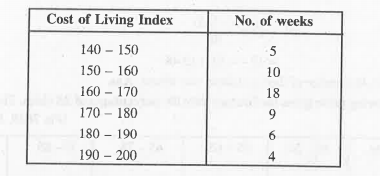
In a city, the following weekly observations were made in a study of cost of living index for the year 1980-81.
 Calculate the mean weekly cost of living index by a suitable method.
View SolutionAn aeroplane, when 3000 m high, passes vertically above another aeroplane at an instant when the angles of elevation of the two aeroplanes from the same point on the ground are 60∘ and 45∘ respectively. Find the vertical distance between the two aeroplanes.
View SolutionA toy is in the form of a cone mounted on a hemisphere of radius 3.5 cm. The total height of the toy is 15.5 cm. Find the surface area of the toy
View SolutionMatch the following lists:

View SolutionHow many lines of symmetry does the above figure have ?
View SolutionWhich of the following are correct chain isomers of butane ? (i)
View SolutionDetermine the point of symmetry of a regular hexagon.
View SolutionDtermine the images of the following figure about the given line :
View SolutionDraw the bisector of ∠AOB=58∘
ltimg src="https://d10lpgp6xz60nq.cloudfront.net/physics_images/PS_MATH_VII_C05_S01_009_Q01.png" width="80%"gt
View SolutionMatch the following Column A to Column B

View SolutionMatch the following Column A to Column B

View SolutionMatch the following Column A to Column B

View SolutionThe inequation represented by the graph given below is :
View SolutionThe inequation that best describes the graph given below is _________
View SolutionThe inequation that best describes the following graph is _________
View Solution
