Complete Solutions to Test Yourself of chapter MEAN,MEDAN,MODE OF GROUPED,DATA CUMULATIVE FREQUENCY GRAPH AND OGIVE of Class 10 book with complete answers and questions
| Class 10 | MATHS |
| Chapter | MEAN,MEDAN,MODE OF GROUPED,DATA CUMULATIVE FREQUENCY GRAPH AND OGIVE |
| RS AGGARWAL | Test Yourself |
| Number Of Questions | 18 |
| Academic Year | 2023-24 |
Which one of the following measures is determined only after the construction frequency distributions
View SolutionIf the mean of a data is 27 and its median is 33 then the mode is
View SolutionConsider the following distribution

The sum of the lower of the median class and the modal class is
View SolutionConsider the following frequency distribution

The upper limit of the median class is
View SolutionIf the mean and mode of a frequency distribution be 53.4 and 55.2 respectively, find the median
View SolutionConsider the following frequency distribution

Find the upper limit of the median class.
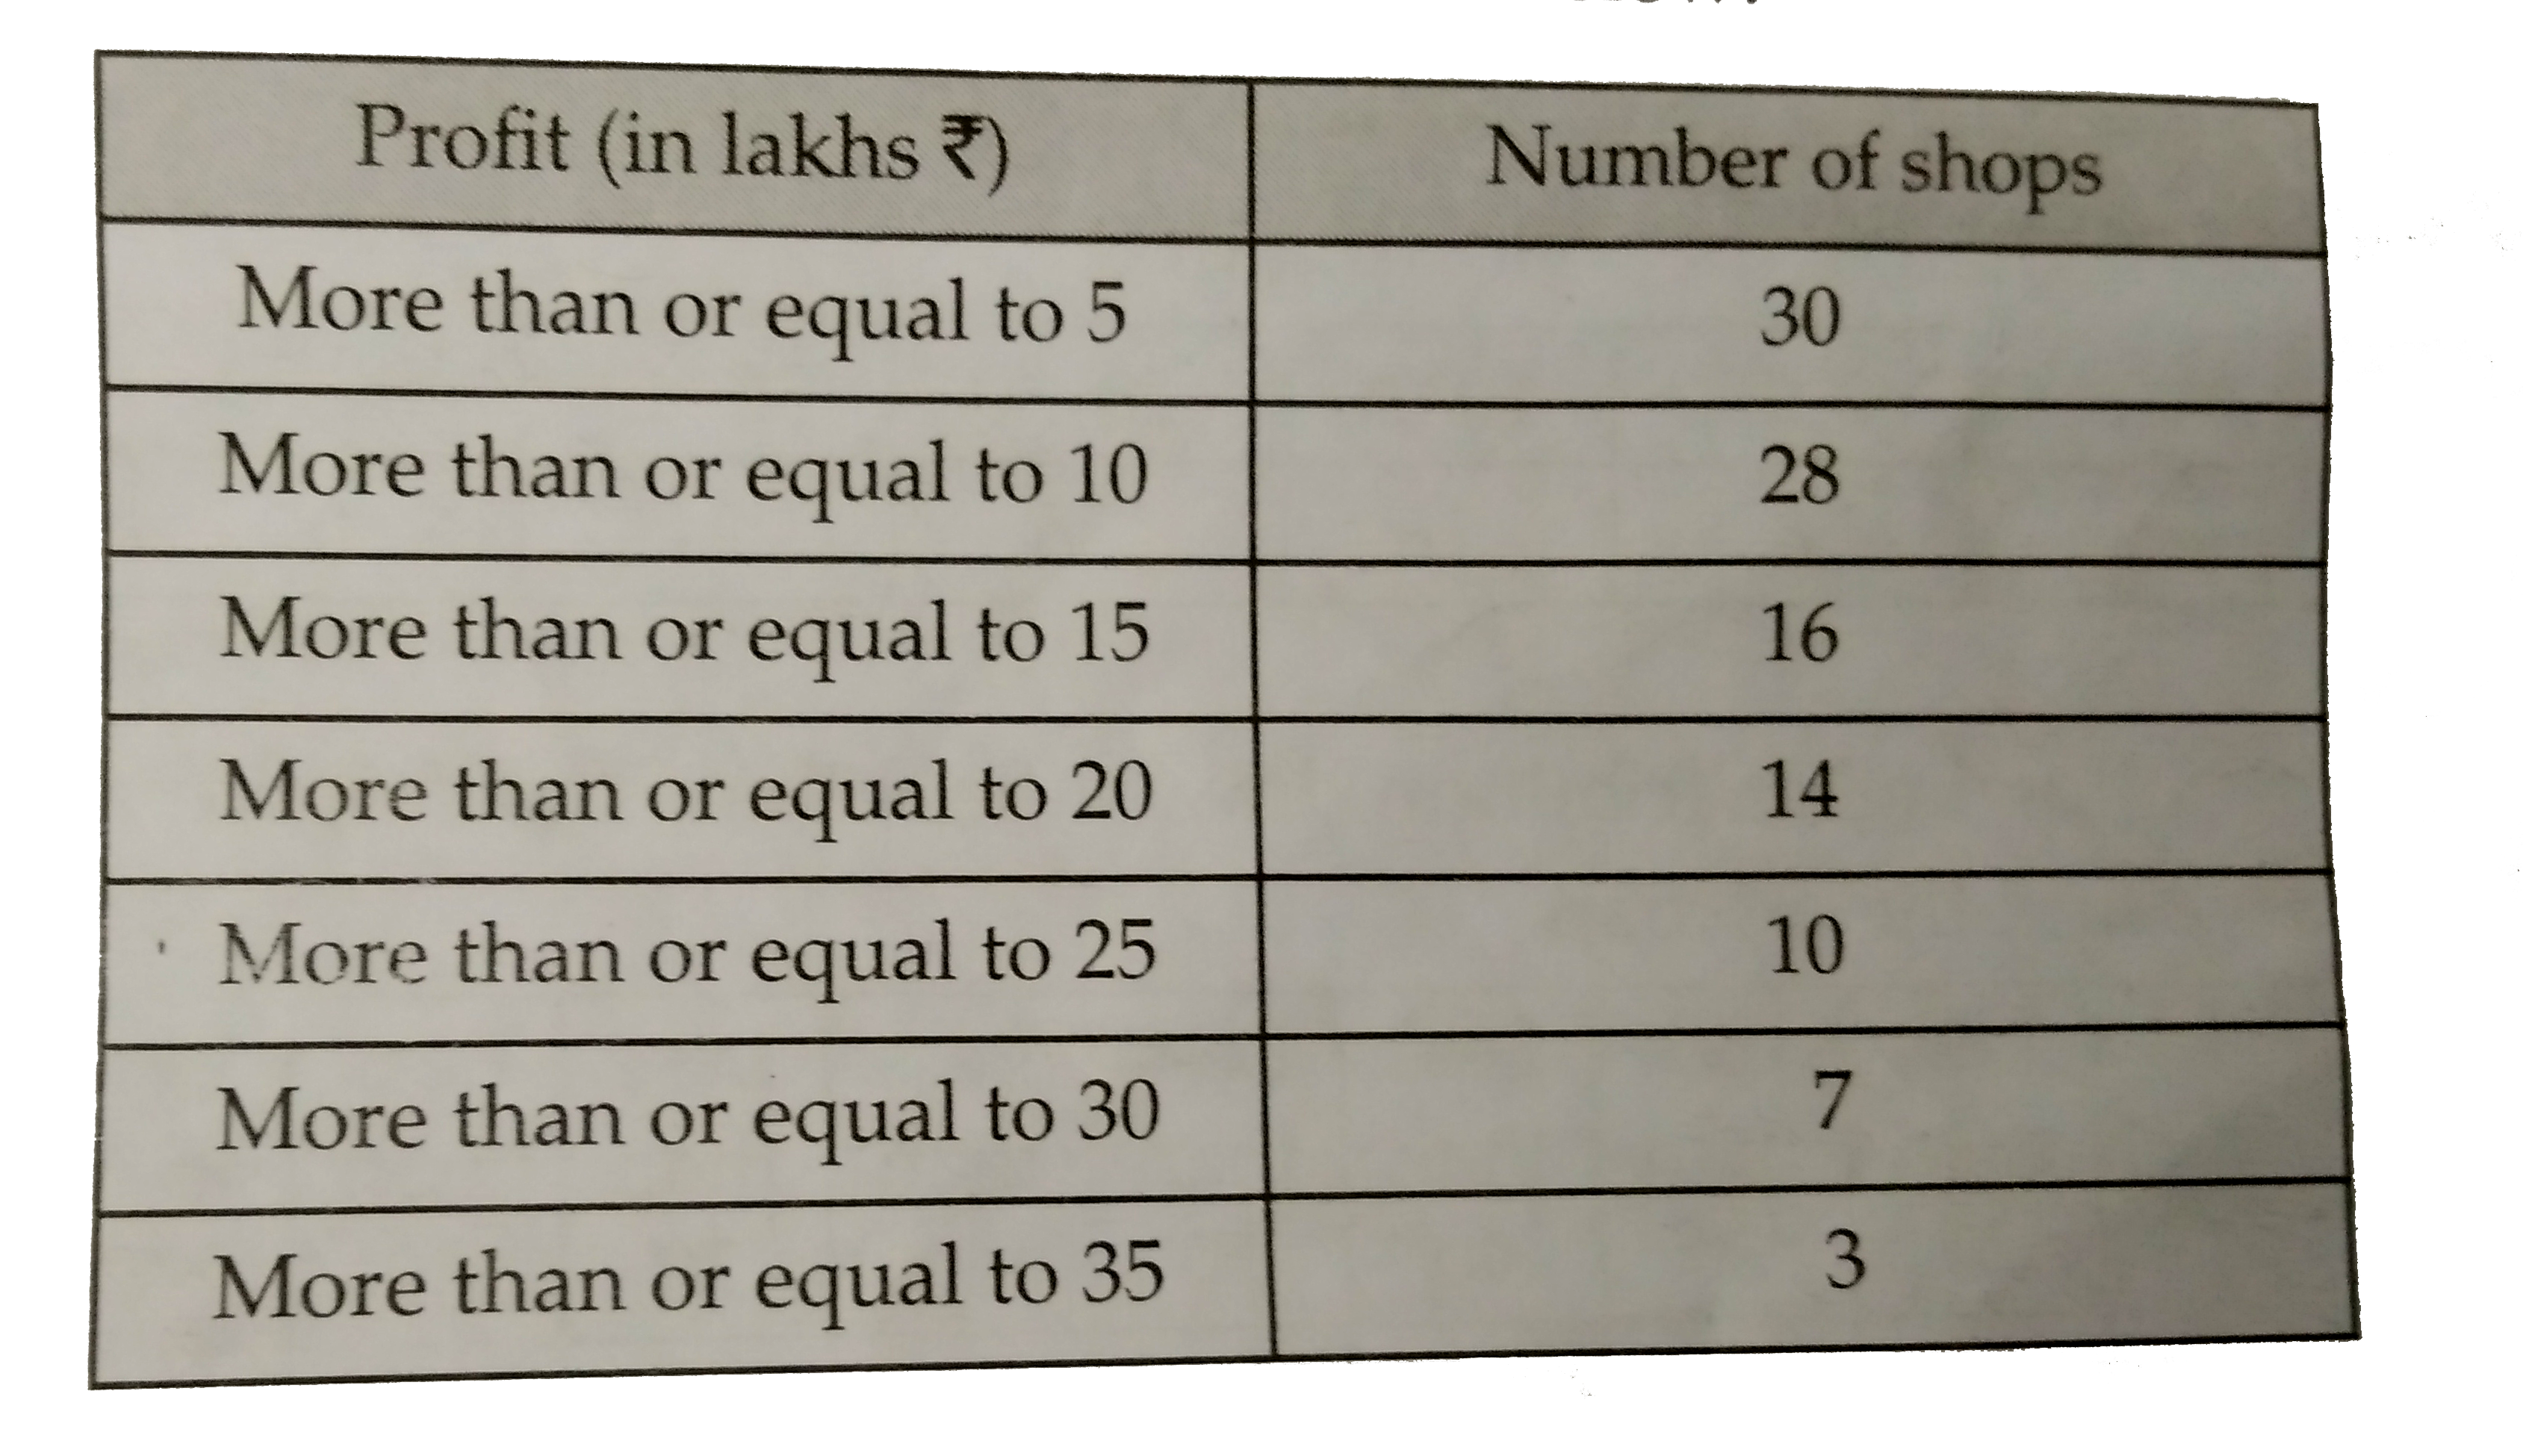
View SolutionThe annual profits earned by 30 shops of a shopping complex in a locality are recorded in the table shown below

If we draw the frequency distribution table for the above data, find the frequency corresponding to the class 20- 25.
View SolutionFind the mean of the following frequency distribution:

View SolutionThe maximum bowling speeds (in km/hr) of 33 players at a cricket coaching centre are given below:

Calculate the median bowling speed.
View SolutionThe arithmetic mean of the following frequency distribution is 25

Find the value of p.
View SolutionFind the median of the following frequency distribution

View SolutionFollowing is the distribution of marks of 70 students in a periodical test

Draw a cumulative frequency curve for the above data.
View SolutionFind the median of the following data.

View SolutionFor the following distribution draw a 'less than type' ogive and from the curve find the median.

View SolutionFind the missing frequencies `f_1` and `f_2` in the table given below, it being given that the mean of the given frequency distribution is 50.

View SolutionFind the mean of the following frequency distribution using step- deviation method

View SolutionDraw 'less than ogive' and 'more than ogive' on a single graph paper and hence find the median of the following data:

View SolutionThe production yield per hectare of wheat of some farms of a village are given in the following table:

Draw a less than type ogive and a more than type ogive for this data.
View Solution
Test Yourself questions and complete solutions for chapter MEAN,MEDAN,MODE OF GROUPED,DATA CUMULATIVE FREQUENCY GRAPH AND OGIVE of RS AGGARWAL MATHS (HINGLISH) of Class 10