Complete Solutions to SOLVED EXAMPLES of chapter MEAN,MEDAN,MODE OF GROUPED,DATA CUMULATIVE FREQUENCY GRAPH AND OGIVE of Class 10 book with complete answers and questions
| Class 10 | MATHS |
| Chapter | MEAN,MEDAN,MODE OF GROUPED,DATA CUMULATIVE FREQUENCY GRAPH AND OGIVE |
| RS AGGARWAL | SOLVED EXAMPLES |
| Number Of Questions | 18 |
| Academic Year | 2023-24 |
Find the median of the following data

View SolutionFind the median wage from the following data

View SolutionFind the median for the following frequency distributution

View SolutionGiven below is the distribution of IQ of 100 students . Find the median IQ

View SolutionCalculate the median class for the following data

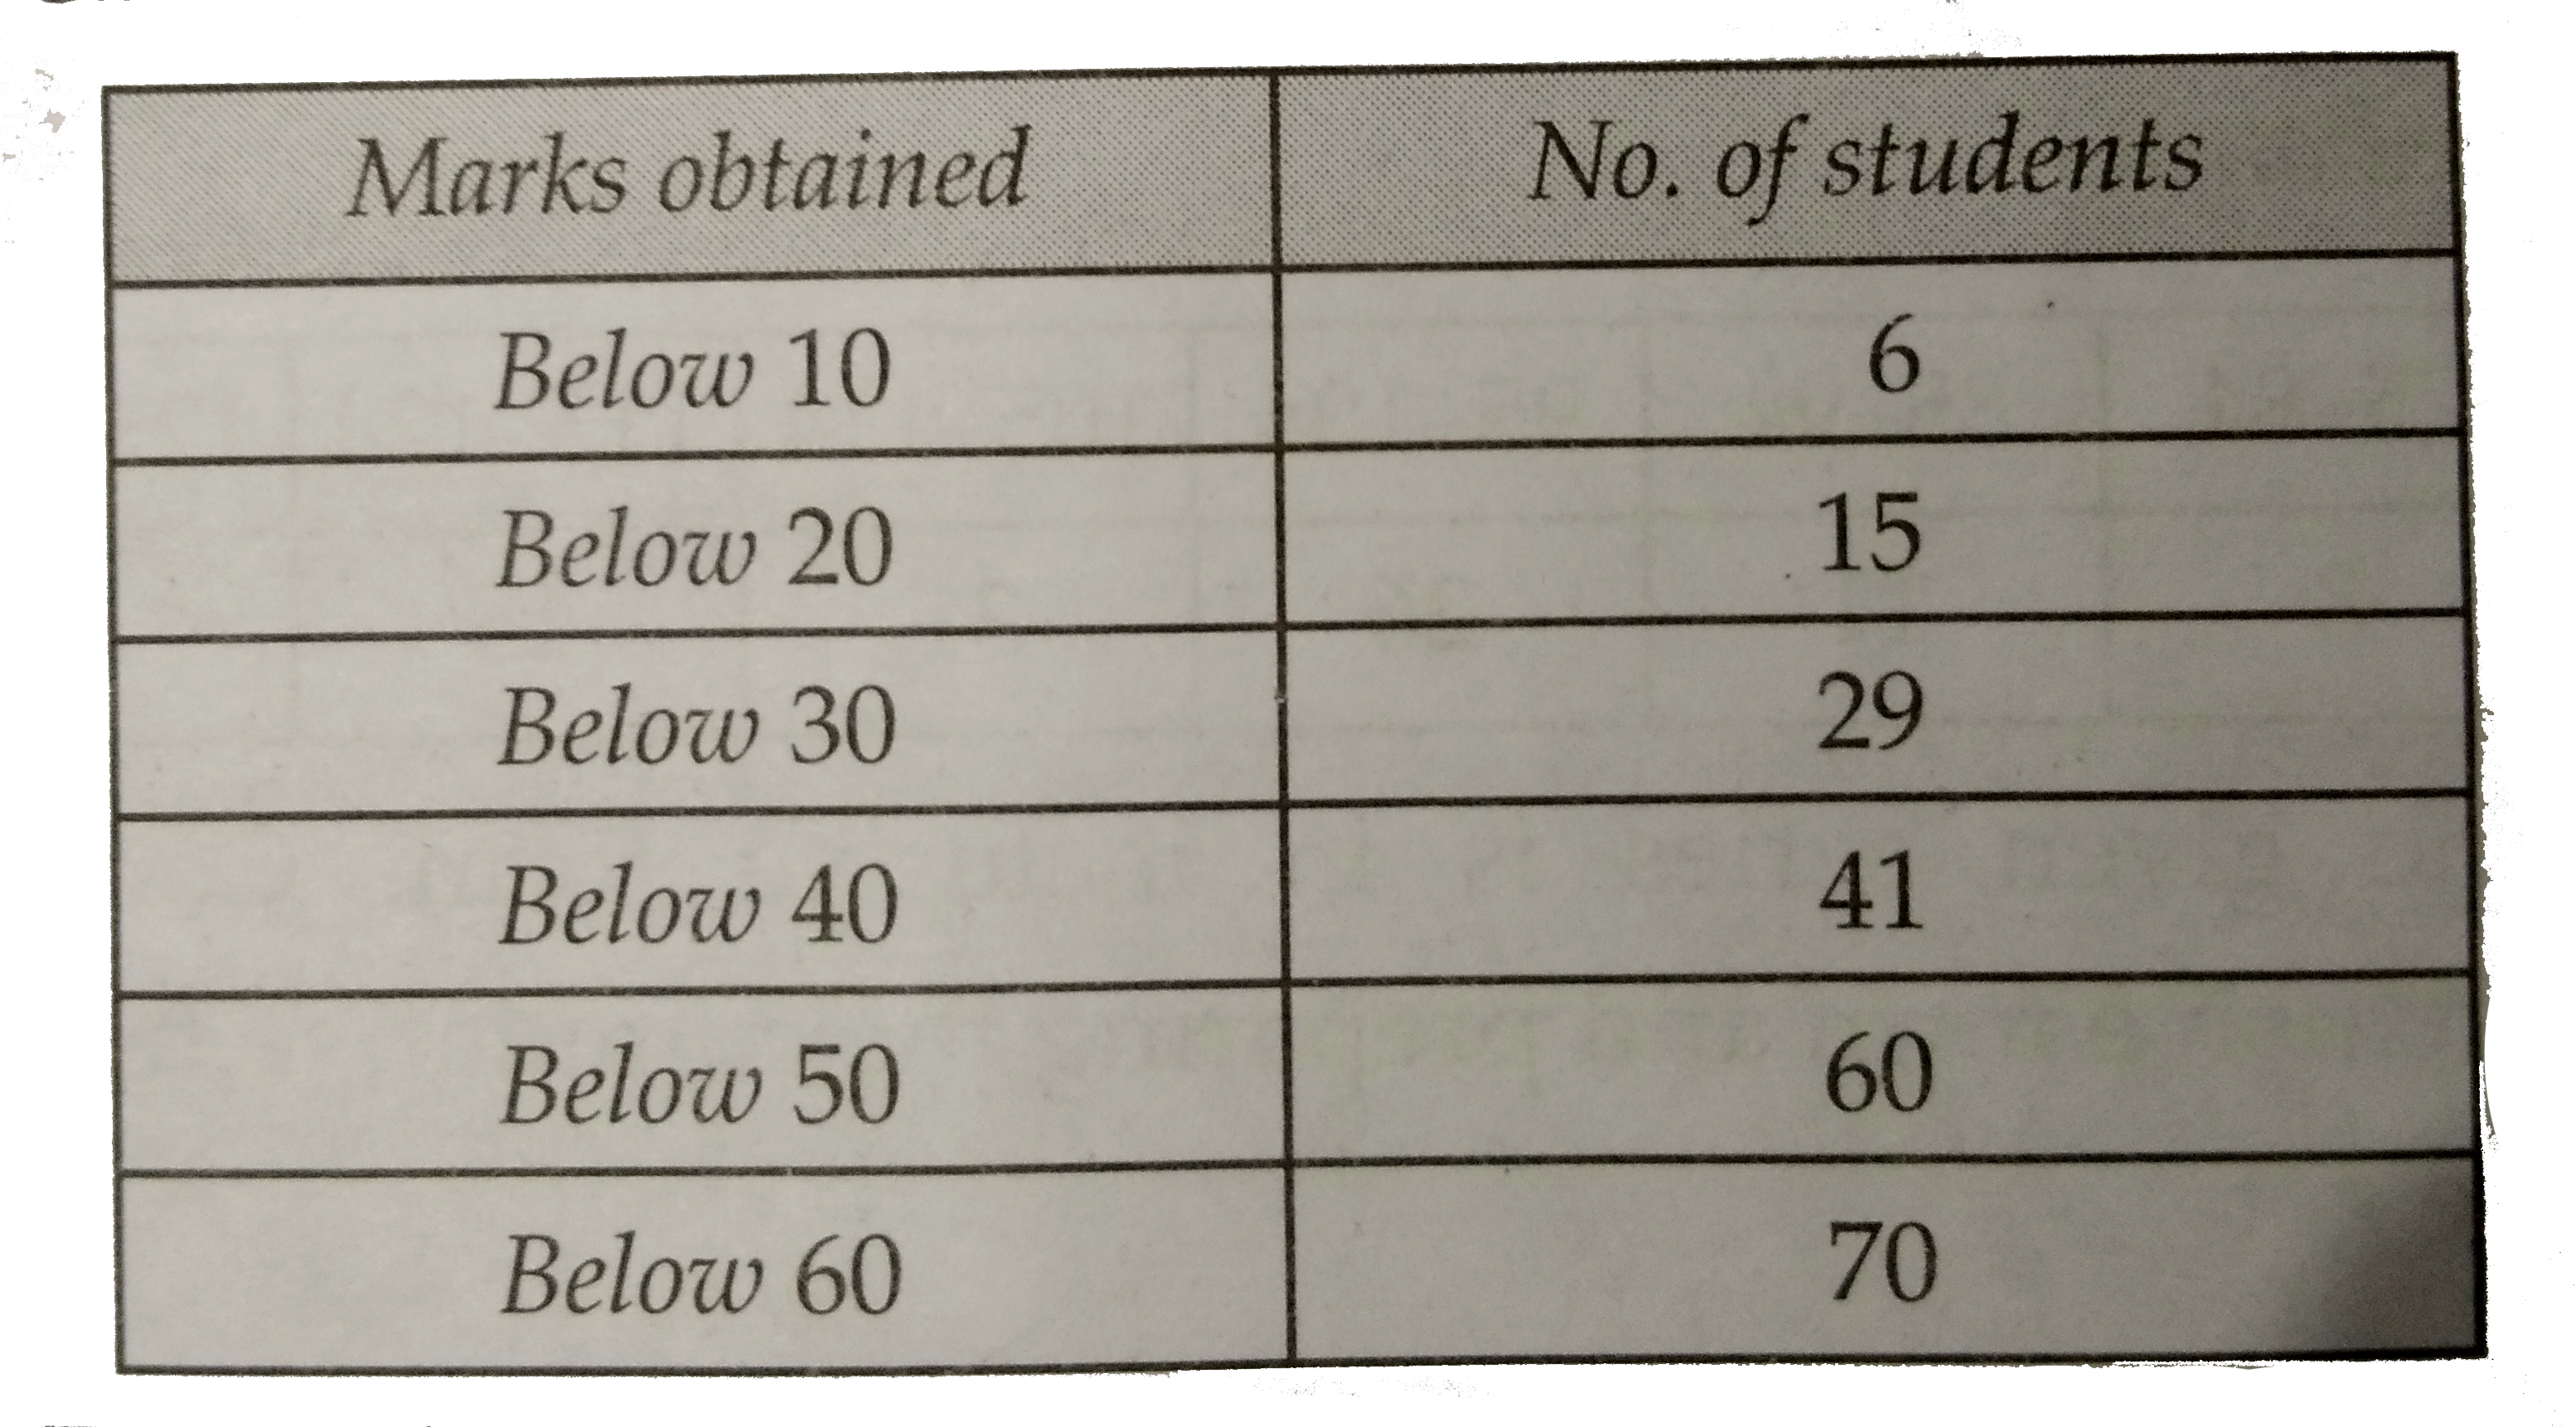
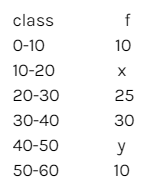
View SolutionFind the missing frequencies in the following frequencies distribution table , if N=100 and median is 32
View SolutionFind the mode of the following data

View SolutionThe distribution of sale of shirts sold in a month in a departmental store is as under

Calculate the modal size of shirts sold
View SolutionGiven below is the frequency distribution of the heights pof the players in a school

Find the average height of the maximum number of students?
View SolutionThe following table shows the ages of the patients admitted in hospital during a month :

Find the mode and the means of the data given above.Compare and interpret the two measure of central tendency.
View SolutionThe mode of the following series is 36 . Find the missing frequency in it

View SolutionCompare the modal ages of two groups of students appearing for an entrance examination

View SolutionThe following table shows the marks obtained by 100 students of Class X in a school during a particular academic session . Find the mode of this distribution

View SolutionFollowing is the age distribution of a group of a student . Draw the cumulative frequency curve of 'less than ' type and hence obtain the median value

View SolutionFor the following frequency distribution , draw a cumulative frequency curve of more than type and hence obtain the median value

View SolutionThe following table gives production yield per hectare of wheat of 100 farms of a village

Change the distribution to a 'more than' type distribution and draw its ogive
View SolutionDuring the medical check-up of 35 students of a class their weights were recorded as follows

Draw a less than type and a more than type ogive from the given data. Hence, obtain the median weight from. the graph
View SolutionThe table given below shows the frequency distribution of the scores obtained by 200 candidates in a BCA entrance examination.

Draw cumulative frequency curves by using ( i) 'less than' series and (ii) 'more than' series.
Hence, find the median
View Solution
SOLVED EXAMPLES questions and complete solutions for chapter MEAN,MEDAN,MODE OF GROUPED,DATA CUMULATIVE FREQUENCY GRAPH AND OGIVE of RS AGGARWAL MATHS (HINGLISH) of Class 10
