Complete Solutions to MUTIPLE-CHOICE QUESTIONS (MCQ) of chapter MEAN,MEDAN,MODE OF GROUPED,DATA CUMULATIVE FREQUENCY GRAPH AND OGIVE of Class 10 book with complete answers and questions
| Class 10 | MATHS |
| Chapter | MEAN,MEDAN,MODE OF GROUPED,DATA CUMULATIVE FREQUENCY GRAPH AND OGIVE |
| RS AGGARWAL | MUTIPLE-CHOICE QUESTIONS (MCQ) |
| Number Of Questions | 8 |
| Academic Year | 2023-24 |
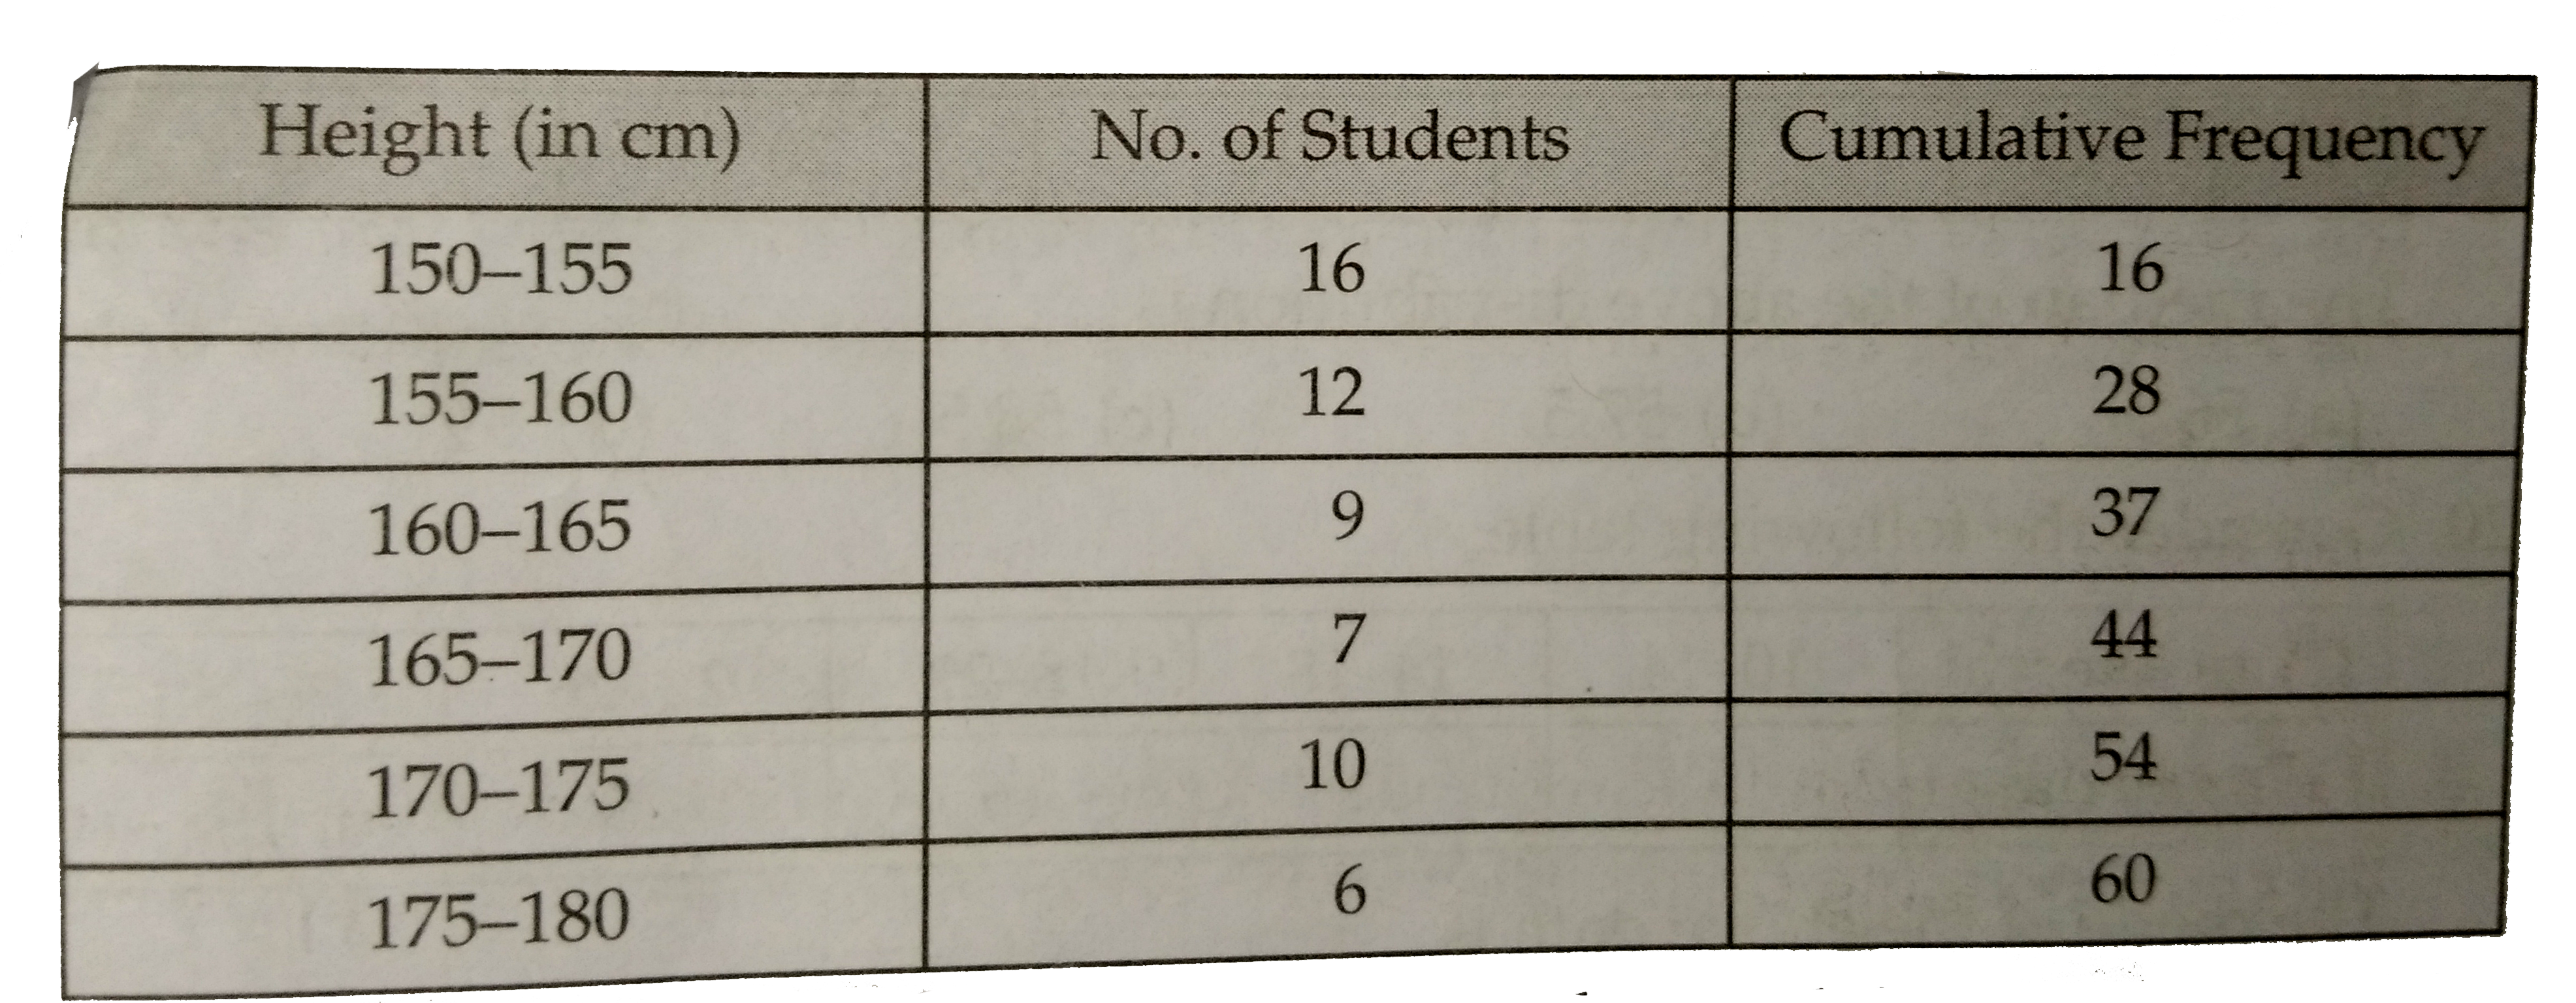
Consider the frequency distribution of the hights of 60 students of a class

The sum of the lower limit of the modal class and the upper limit of the median class is
View SolutionConsider the following frequency distribution

The modal class is
View SolutionLook at the frequency distribution table given below

The median of the above distribution is
View SolutionCosider the following table

The mode of the above data is
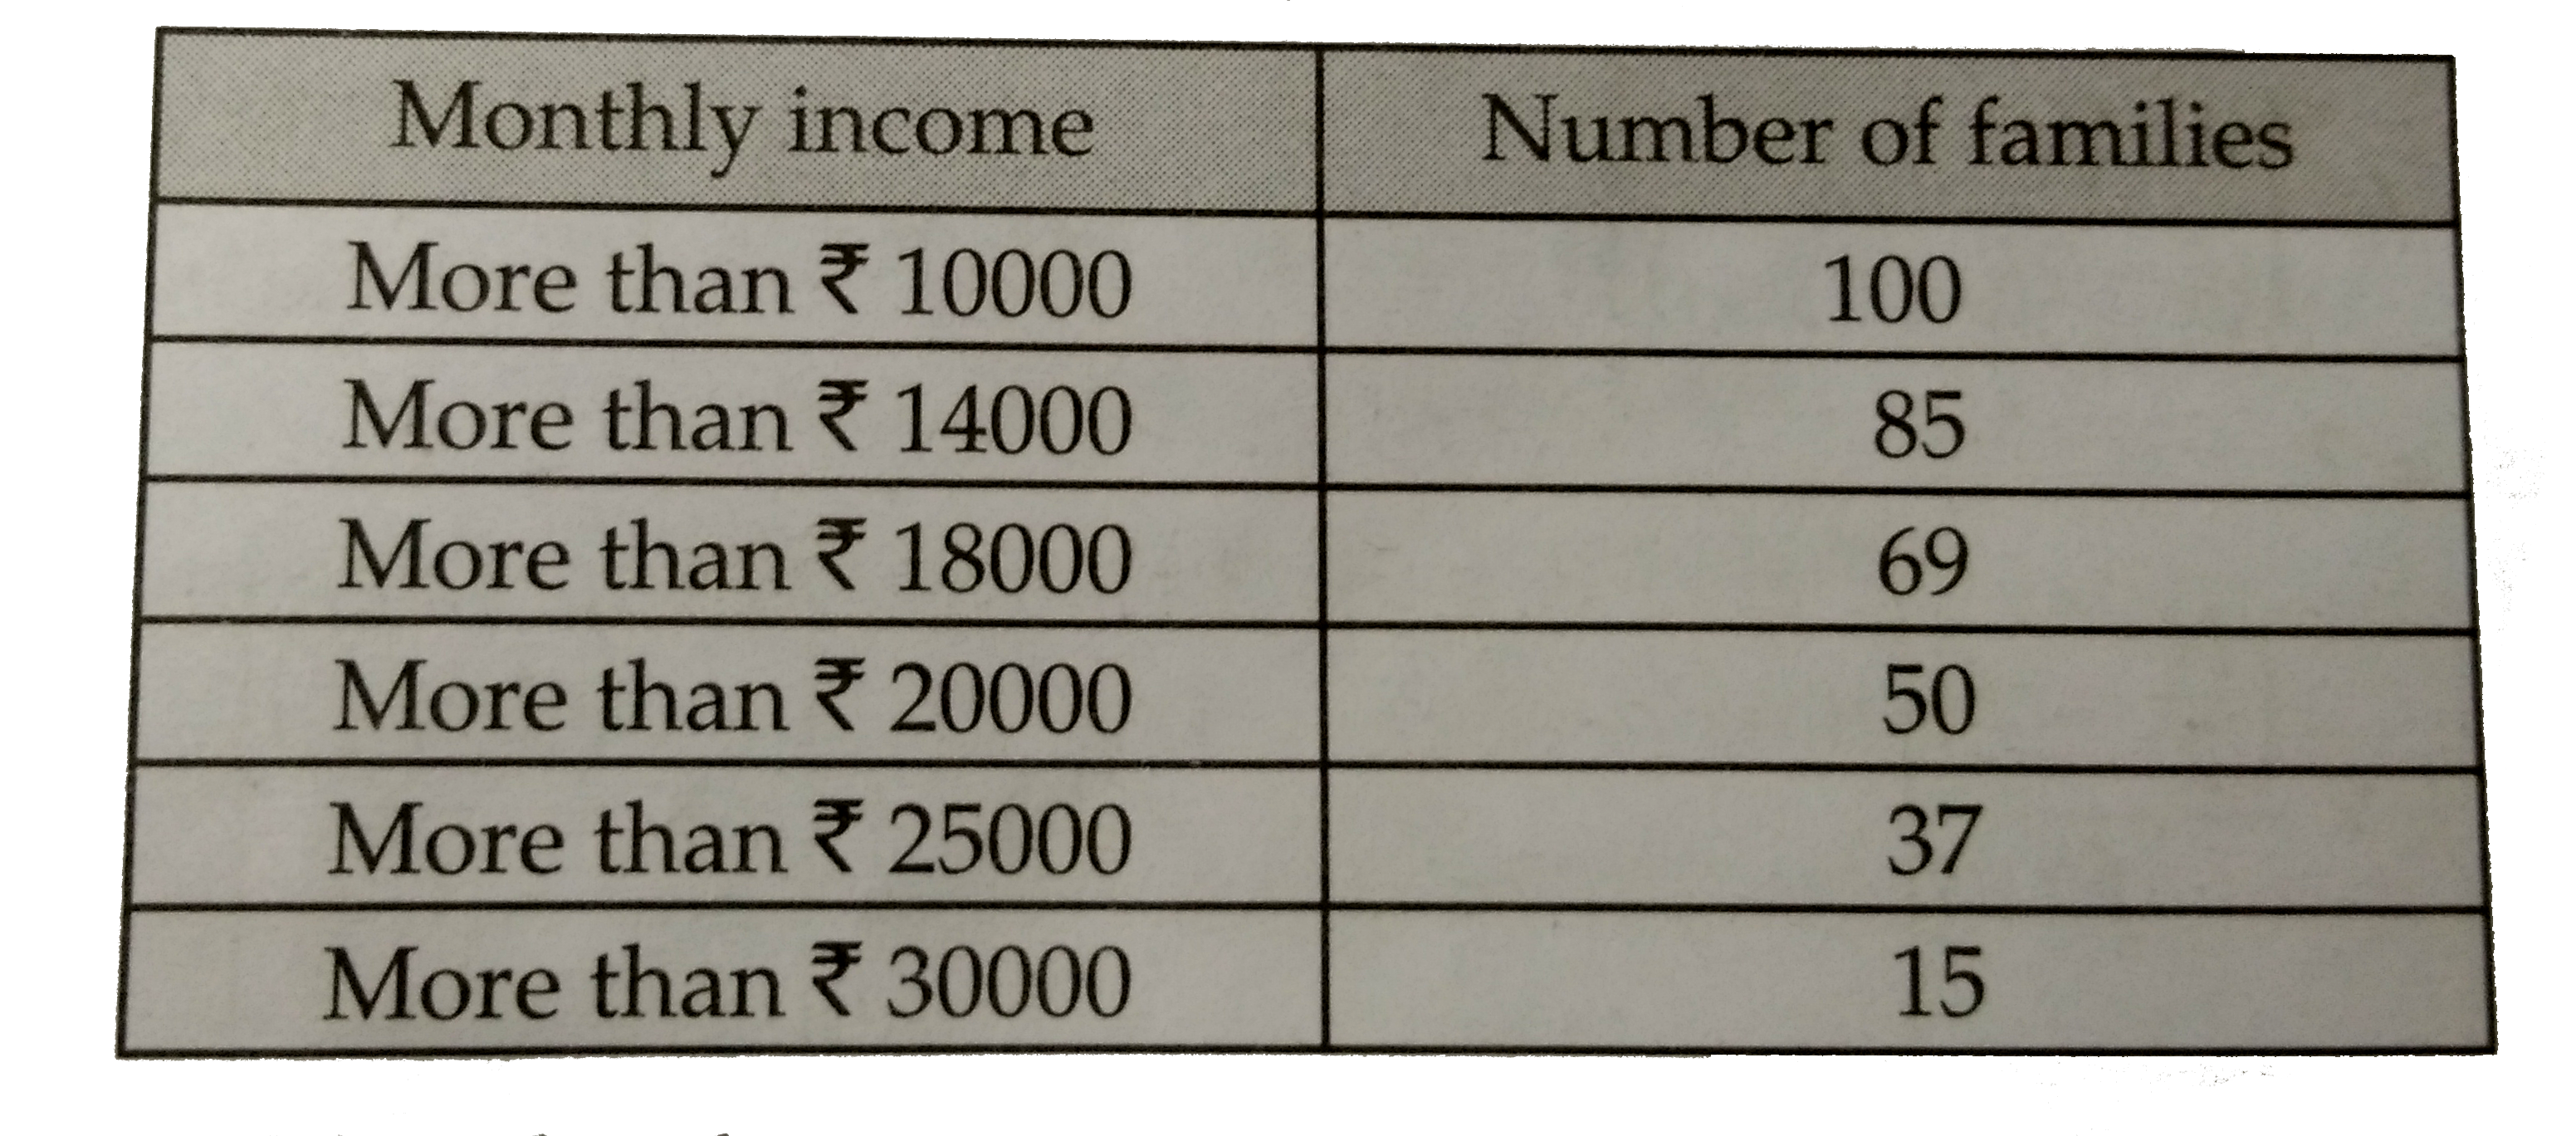
View SolutionLook at the cumulative frequency distribution table given below

Number of families having income range 20000 to 25000 is
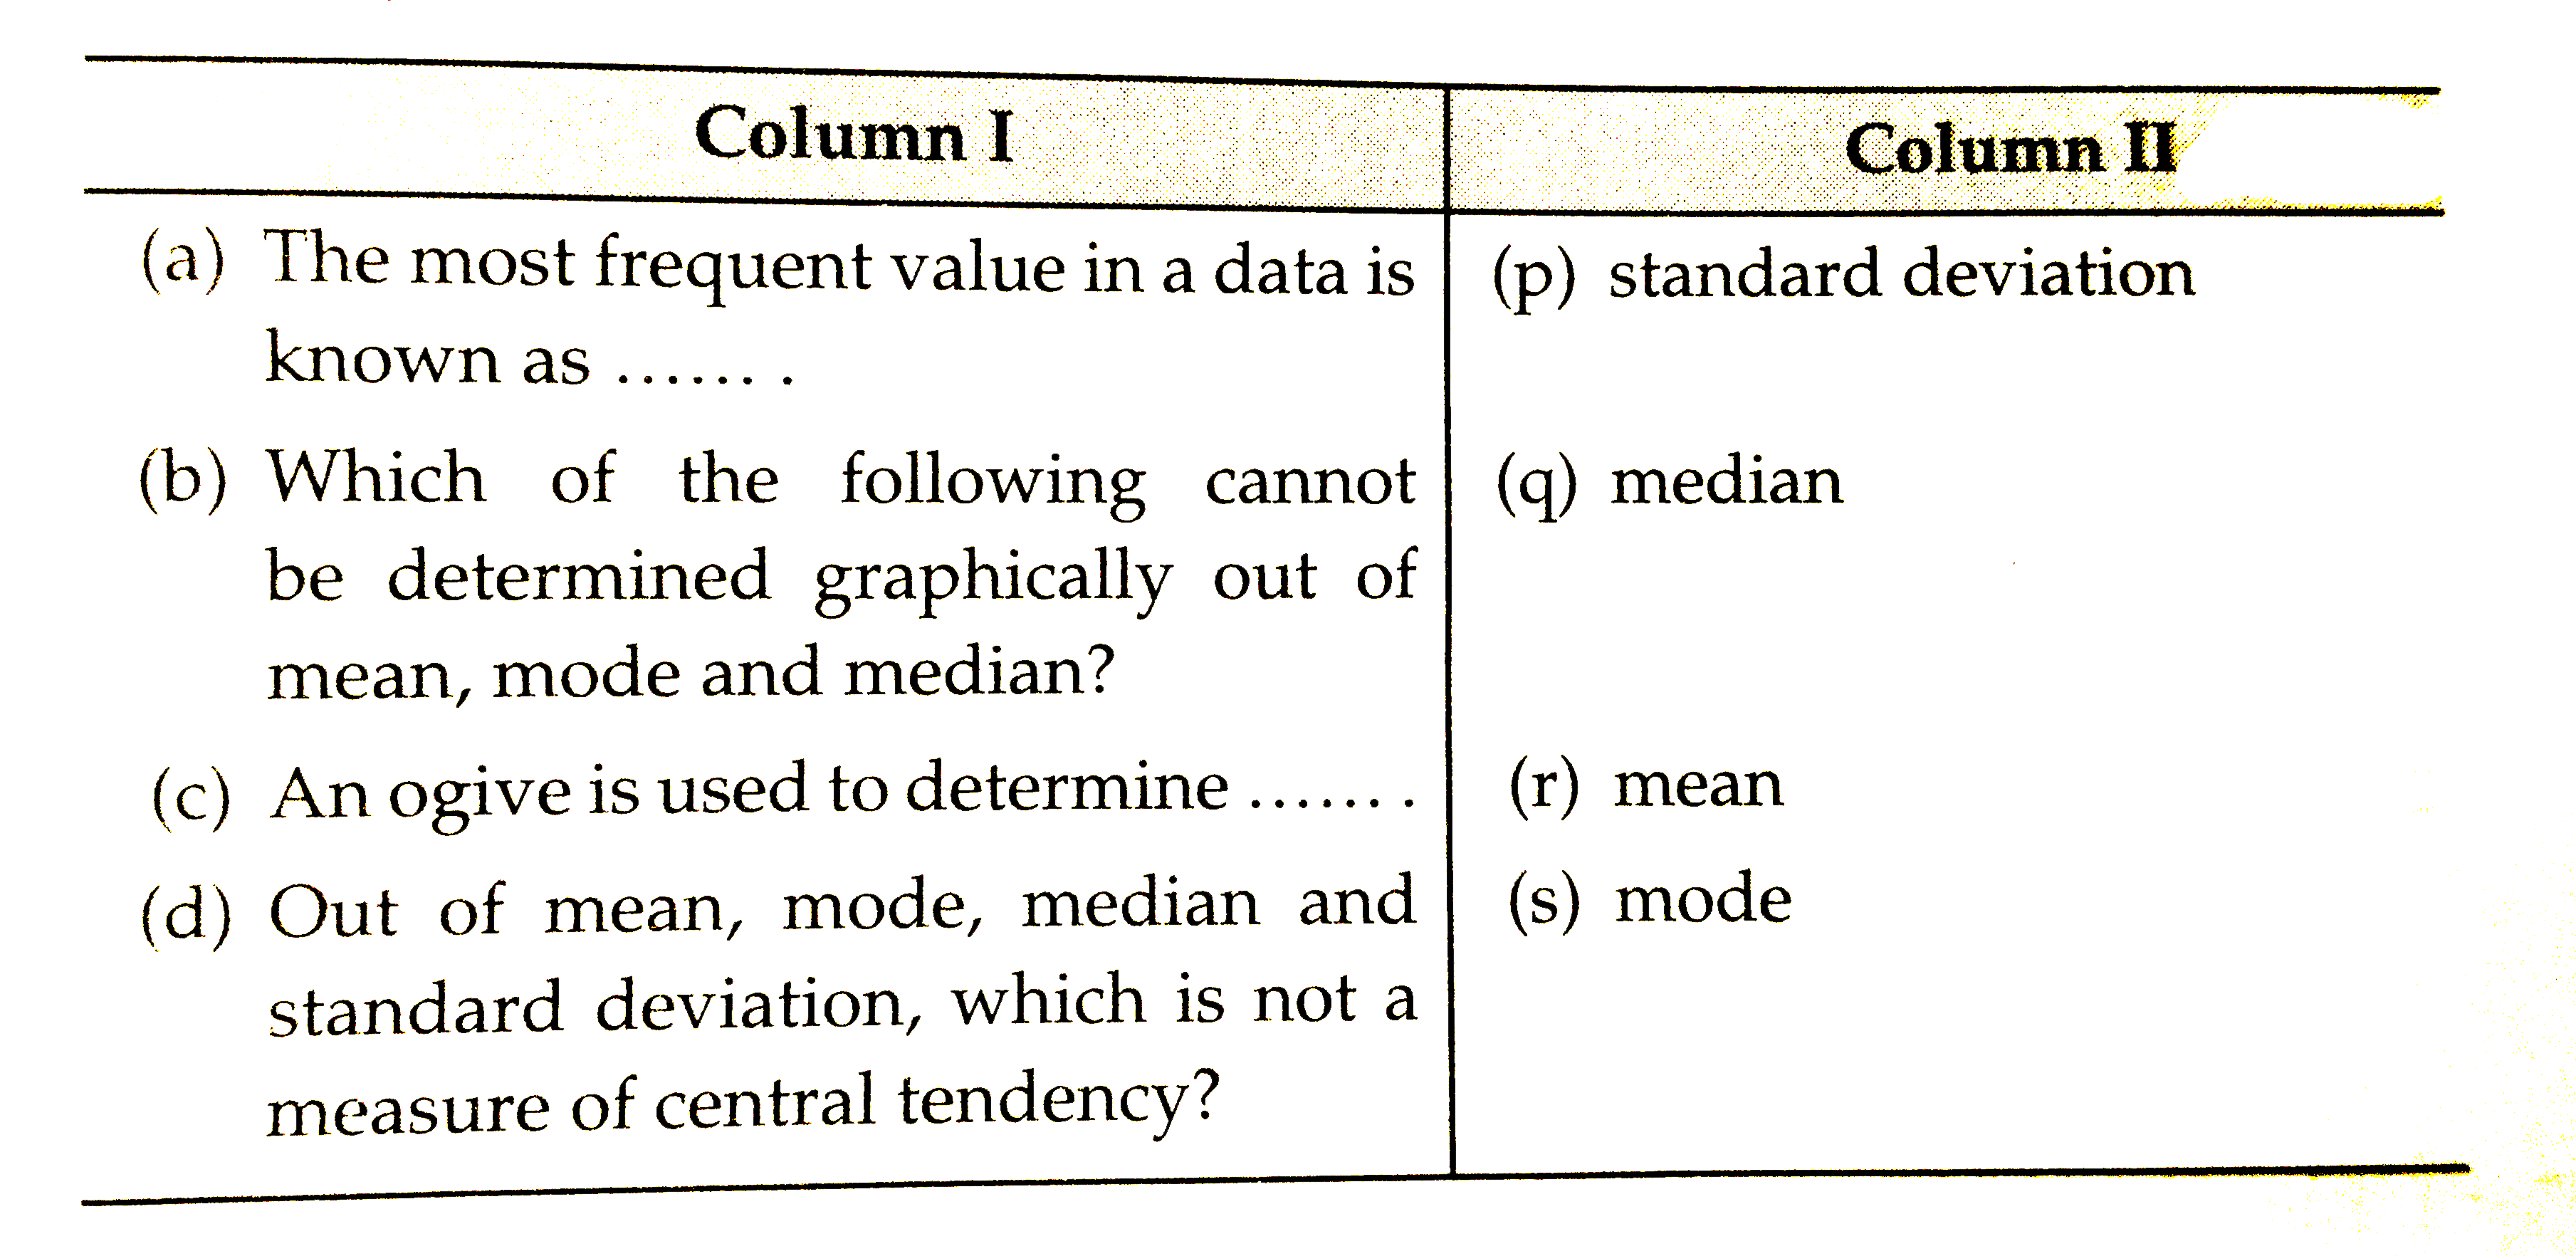
View SolutionMatch the following columns :

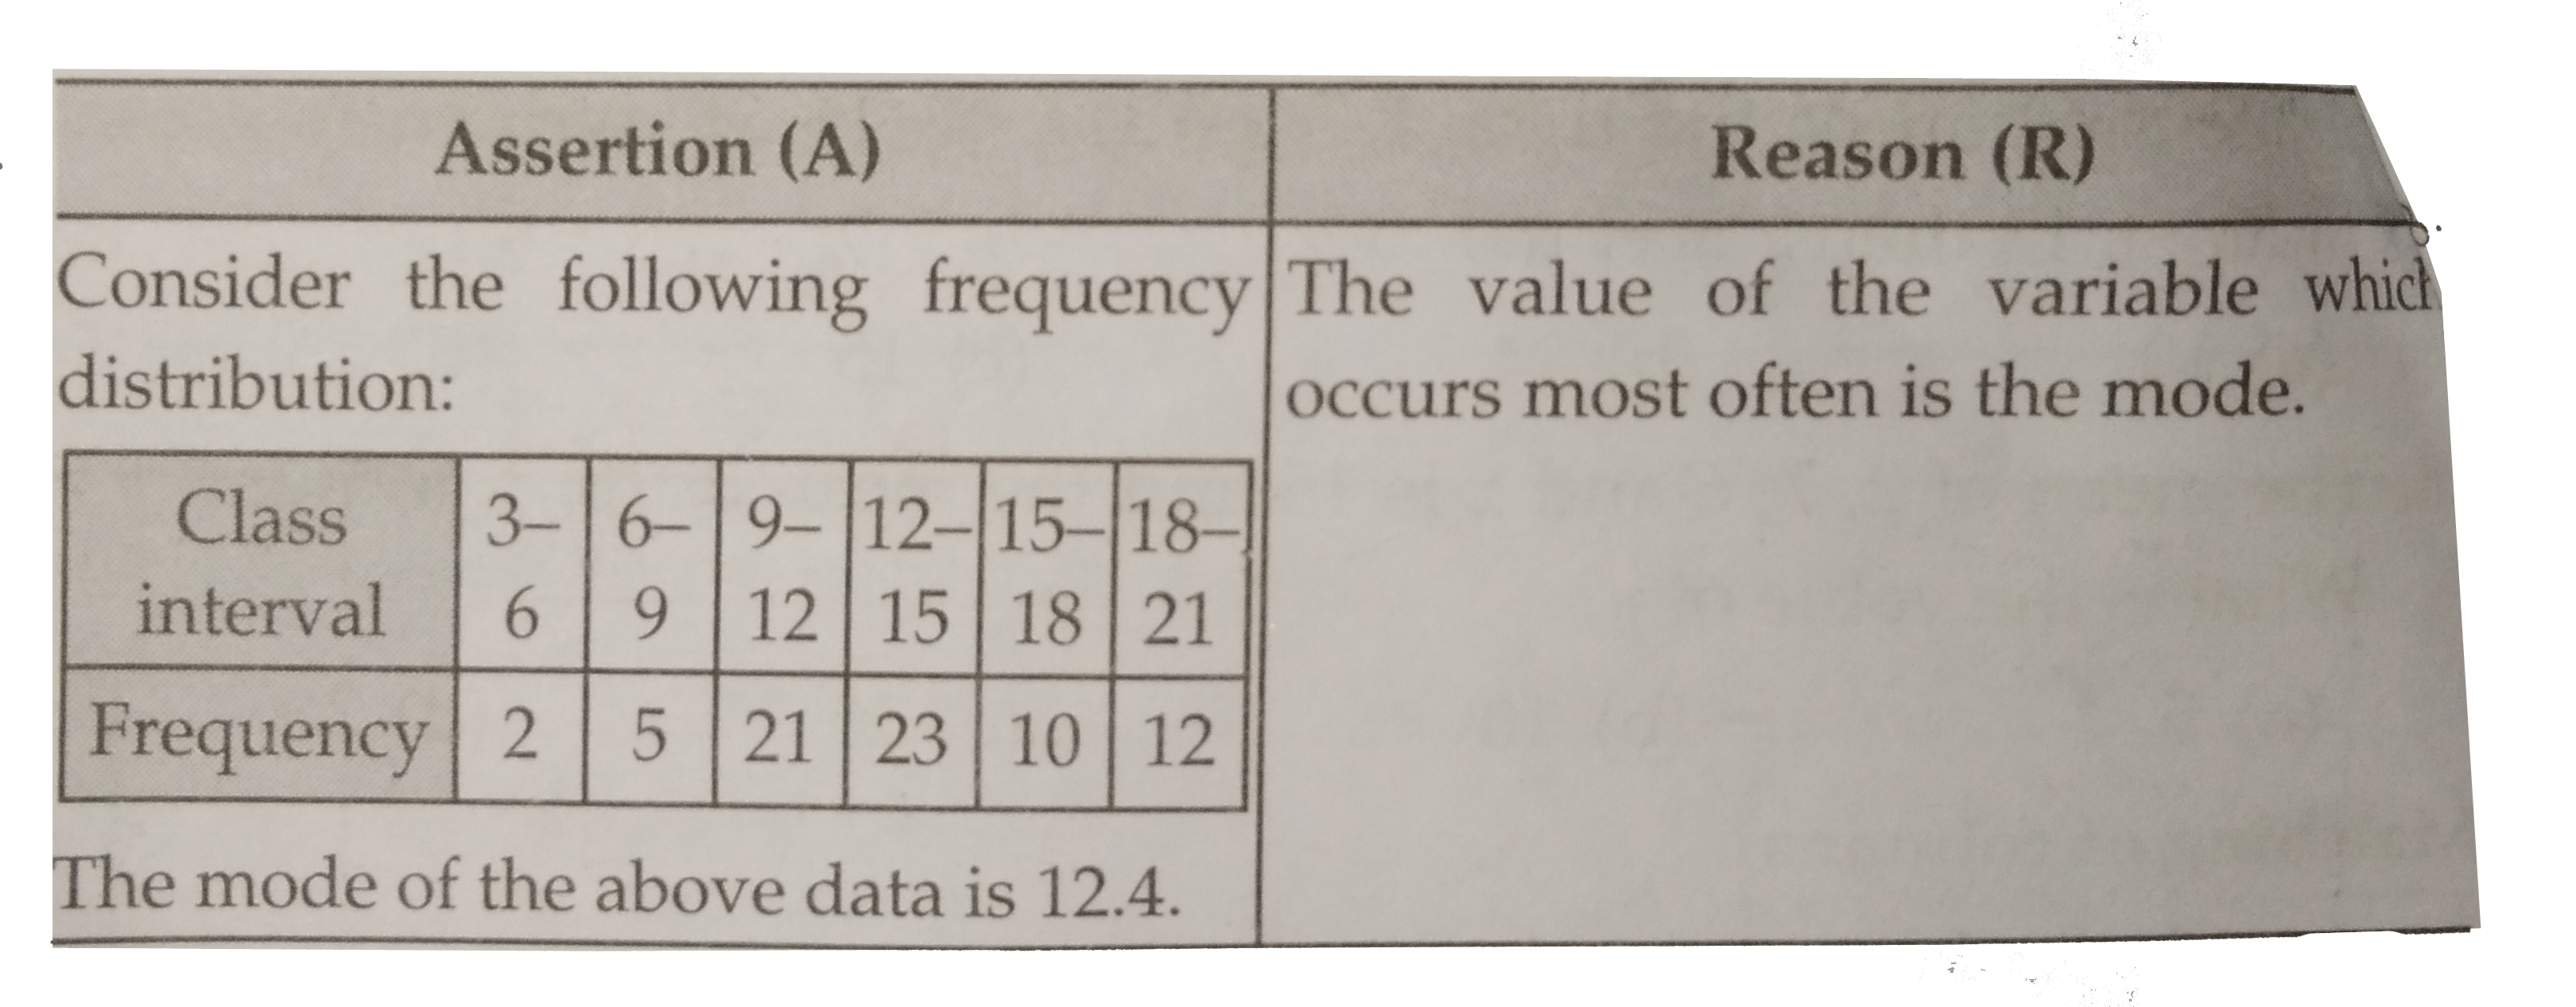
View SolutionEach question consists of two statement ,namely, Assertion (A) and Reason ( R ) For selecting the correct answer use the following code :
 The correct answer is : (a) / (b) /( c) /(d)
View SolutionEach question consists of two statement ,namely, Assertion (A) and Reason ( R ) For selecting the correct answer use the following code :

The correct answer is : (a) / (b) /( c) /(d)
View Solution
MUTIPLE-CHOICE QUESTIONS (MCQ) questions and complete solutions for chapter MEAN,MEDAN,MODE OF GROUPED,DATA CUMULATIVE FREQUENCY GRAPH AND OGIVE of RS AGGARWAL MATHS (HINGLISH) of Class 10